Visualize
InfluxDB 2.0 built-in visualization tools.
If InfluxDB version 2.0 is used as TSDB, to visualize data stored in the TSDB you can use its built-in visualization tools. For details, refer to InfluxDB documentation at https://v2.docs.influxdata.com/v2.0/visualize-data/.
Visualization with Grafana.
The open source platform Grafana can be used to visualize data in different ways:
via ogamma Visual Logger for OPC REST API endpoint at path
/grafana/query, with SimpleJson or Infinity data source plugin for Grafana. TheSimpleJsoncan be used in Grafana versions up to version 9.x. In the later versions of Grafana (10.x or higer) it is not supported anymore. With those versions, theInfinityplugin can be used, via the same ogamma Visual Logger for OPC REST API endpoint.In this case, ogamma Visual Logger for OPC can receive data from OPC UA Servers either directly via live connection, or data can be read from the TSDB.
Getting data from the OPC UA Server directly
This is done when value in the column
Get History fromof theLogged Variablestable for a variable is set toOPC UA server. In turn can be done in 2 ways:using
ReadOPC UA service call. Applicable when the option in theRead Typecolumn of theLogged Variablestable for the variable is set toRead.using
HistoryReadOPC UA Service call. Applicable for variables, that haveHistoryzingattribute set totrue, and value of the columnRead Typeis set toHistoryReadRaw.
Data is read from the time-series database. Applicable when value in the column
Log to TSDBfor a variable is set totrue(which is default value when variables are added to theLogged Variablestable).
Via native datasource plugins of Grafana. In this case data that is already stored in the TSDB by ogamma Visual Logger for OPC, is read by the plugin, without participation of the ogamma Visual Logger for OPC.
Grafana has following plugins that can read data from databases supported by the ogamma Visual Logger for OPC:
For InfluxDB there are 2 plugins: InfluxDB plugin (currently active and recommended), and deprecated FlightSQL plugin
Next sections describe how to install and use Grafana.
Install Grafana
The easiest way to install and run Grafana is running it as a Docker container, following instructions at this page: https://grafana.com/docs/grafana/latest/setup-grafana/installation/docker/.
Alternatively, Grafana can be installed in Linux or Windows machines following instructions from Grafana web site.
Once Grafana is installed and runs, its GUI can be accessed from wbe browser via endpoint URL http://localhost:3000.
Setup Grafana data source plugins to get data via ogamma Visual Logger for OPC REST API endpoint
Data from OPC UA Servers can be visualized in Grafana using 2 types of data sources: SimpleJson or Infinity.
Installing of the Infinity plugin.
This section is applicable for Grafana version 11.
In Grafana web GUI select menu
Connections / Data Sourcesin the left side panel.Click on the button
Add new data source.In the opened
Add data source panel, enter name of the pluginInfinity.Click on the found plugin
yesoreyoram-infinity-datasource. As a result, new data source will be created.
Enter arbitrary name of the plugin instance, base URL (ogamma Visual Logger for OPC REST API endpoint,
http://ogamma-logger:4880/grafanain case when both ogamma Visual Logger for OPC and Grafana are running in Docker), and click on the buttonSave & Test. Ignore the warning that health checks were not performed.
Installing of the SimpleJson data source plugin.
Note that this plugin is deprecated and not supported in Grafana versions 10.x and later. Use the Infinity plugin instead iwth latest versions of Grafana.
Install
SimpleJsondata source plugin (instructions are available at https://github.com/grafana/simple-json-datasource).Add data source of
SimpleJsontype, and configure it to connect to the Grafana endpoint of the ogamma Visual Logger for OPC. The REST API URL is http://localhost:3000/grafana in case when accessed from the local machine. Replacelocalhostby the host name when applicable.In Grafana from the left side menu bar, select icon
Configuration. Note that in the latest versions of Grafana data sources are organized diferently, underConnectionsmenu.Click on
Data Sources;Click on button
Add data source;

From the list of data sources, select
SimpleJson;Configure settings:
In the field HTTP/URL enter URL of the ogamma Visual Logger for OPC. If ogamma Visual Logger and Grafana are installed in the same machine,
localhostcan be used as a host name:http://localhost:4880/grafanaIf both ogamma Visual Logger for OPC and Grafana are running within Docker container, using file docker-compose.yml and grafana.yml from GitHub project
https://github.com/onewayautomation/ogamma-logger, and fieldaccessis set toserver, then host name should be set toogamma-logger:http://ogamma-logger:4880/grafanaNote
Adjust host name according to your setup.
Click on button
Save and Test. If settings are correct, message should appear saying that data source is working.
Using Grafana data sources to read data from databases directly.
Refer to the documentation for the applicable data source.
As example, to install the PostgreSQL data source:
Open
Data Sourcespage in Grafana, and click on buttonAdd Data Sources.Select
PostgreSQLand edit connection settings as shown in the screenshot:
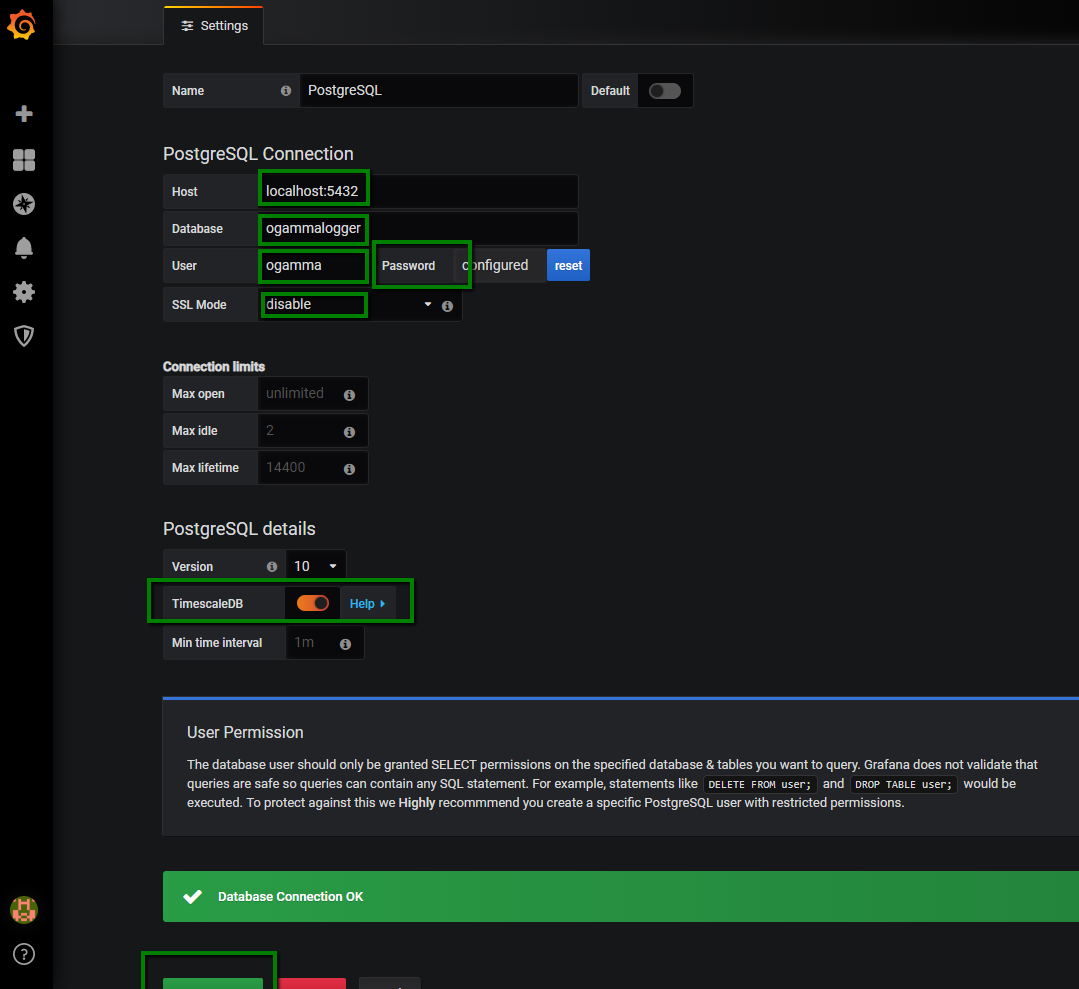
Note
Using the PostgreSQL data source plugin is applicable only when time-series database type in ogamma Visual Logger for OPC is PostgreSQL.
Setup Grafana dashboards.
Create new dashboard.
To create new dashboard, from the left side menu bar click on icon with plus sign, select Dashboard, and click on button Add Query (it suggests to add new panel into new dashboard right away):
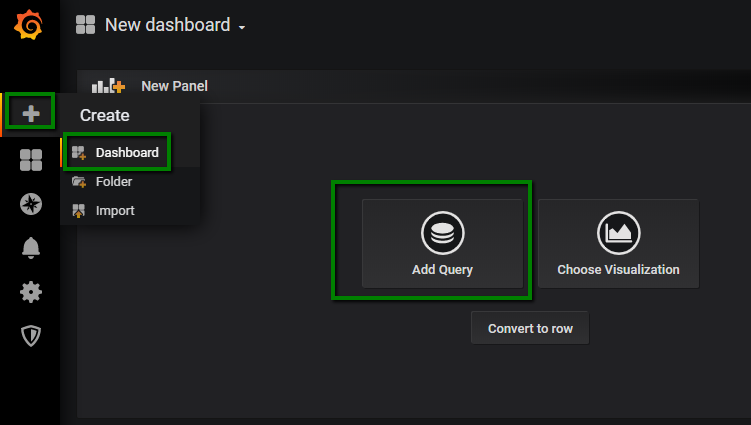
Note that in the latest verions of the Grafana the GUI migh look differently.
Reading values from Infinity data source plugin.
In the dashboard edit panel:
Select the data source by name: see the screenshot below.

Enter query options as shown in the screenshoot:

In the field
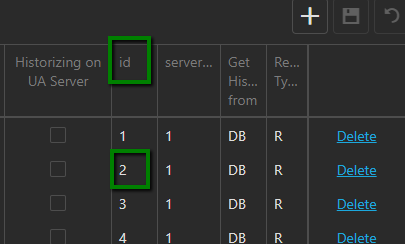
Body Contententer JSON formatted query payload. Change the value of the JSON membertarget(9718in the example below) to the variable Id accordingly to the value of theidcolumn of the variable line from theLogged Variablestable:{ "range": { "from": "${__from:date:iso}", "to": "${__to:date:iso}" }, "targets": [{"target": 9718}] }

Note
If the column
idis not visible in theLogged Variablestable, use column selector to make it visible:
Now we need to configure parsing options:
Expand line
Parsing options & Result fields.In the field
Rows/Rootenterdatapoints(this is name of the JSON member with data values in the http POST response).In the table
Columns - optionaladd 2 lines instructing the plugin how to interpret data values entries:Selector: 0,as: Alias (label),format as: NumberSelector: 1,as: Time,format as: Time (UNix ms)

Now the dashboard panel should have data values received from the ogamma Visual Logger for OPC REST API endpoint.
Reading values from SimpleJson data source plugin.
In this case requests to get data values sent to the ogamma Visual Logger for OPC through its REST endpoint by Grafana’s SimpleJson plugin. Then, depending on settings in columns Get History From and Read Type, data values are read by ogamma Visual Logger either from TSDB, or from OPC UA Server by calling Read or HistoryRead request.
Configure settings in the new panel selecting SimpleJson as data source:

Reading values stored in PostgreSQL database.
It is possible also to read already logged data values from PostgreSQL database, using PostgreSQL data source plugin for Grafana (installation is not required, included into Grafana by default):
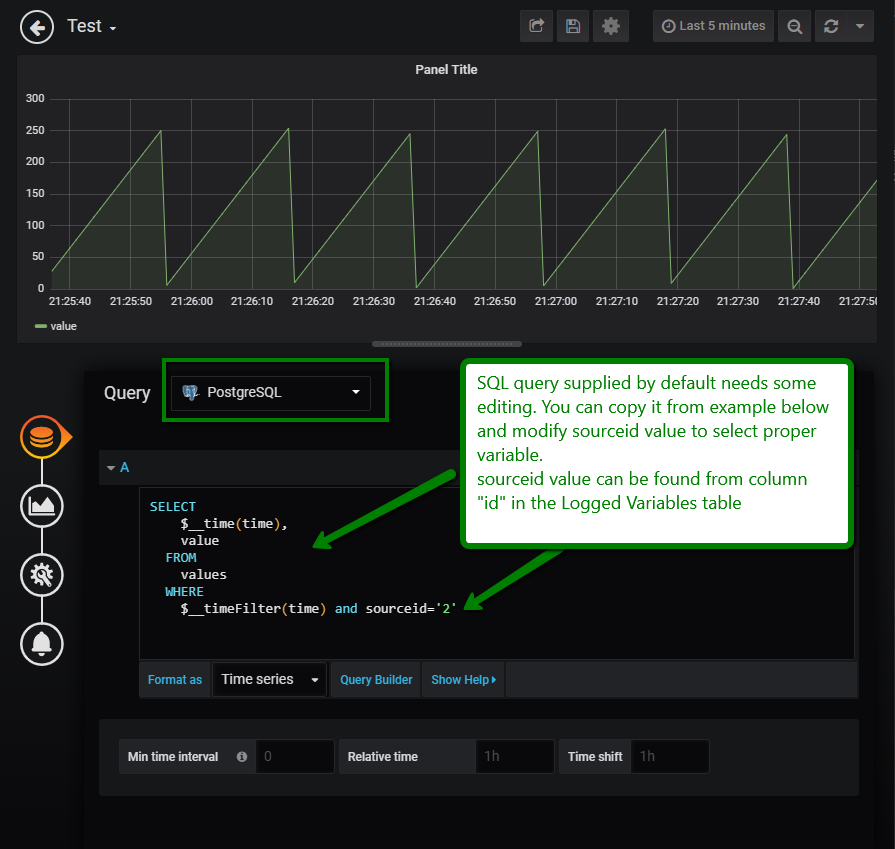
Example of the SQL query can be found below:
SELECT
    $__time(time),
    value
  FROM
    values
  WHERE
    $__timeFilter(time) and sourceid='2'
Here time, value and sourceid are column names in the values table. You can figure out corresponding to the OPC UA variable sourceid from Logged Variables data grid on the configuration GUI (column id).
Tip
For details on how to configure Grafana dahsboards and panels please refer to its documentation here
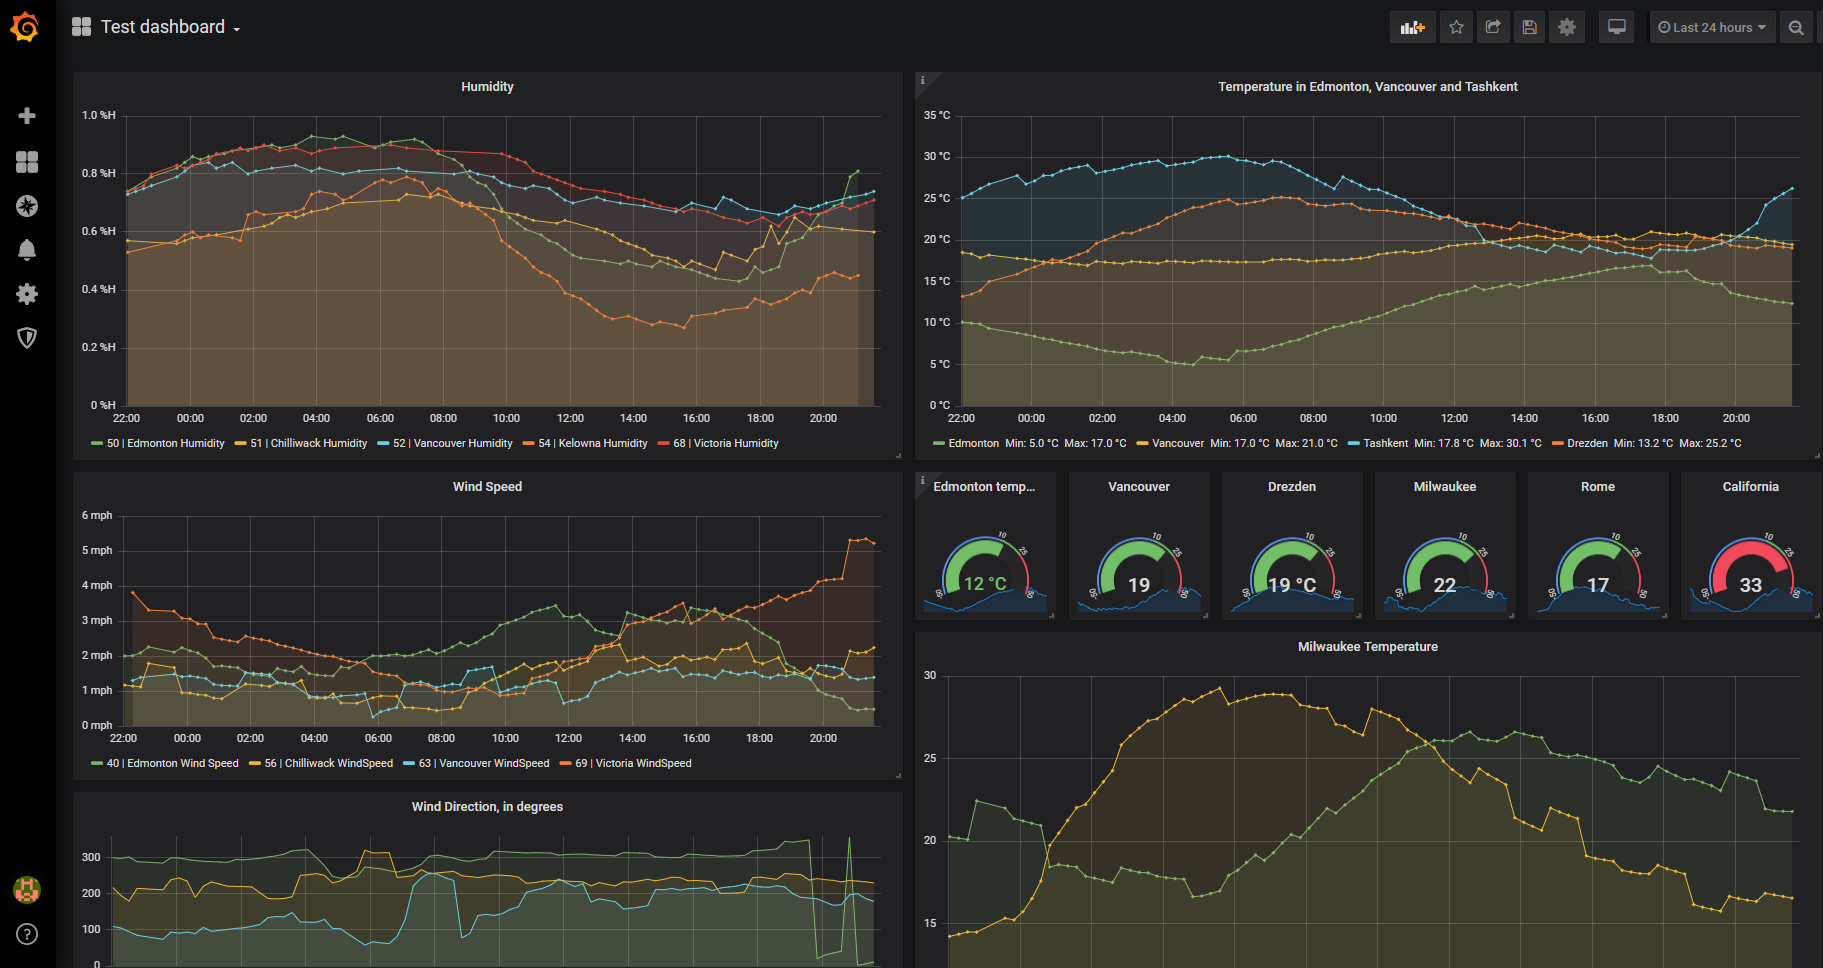
Typical Grafana dashboard is illustrated below: