Analyze
Once data is logged into TSDB, it can be analyzed using different approaches:
Using Grafana for visual representation, which makes easy to notice patterns as well abnormalities;
Running queries against time-series database. Depends on type of timeseries database. *
PostgreSQL: SQL queries using web frontend PgAdmin; *InfluxDb: Flux queries; *Kafka: KSQL queries.Exporting data from TSDB into CSV file and analysis of that data in Microsoft Excel.
Test use case
As a use case, lets try to use ogamma Visual Logger for OPC to verify that OPC UA Server under test generates data values at expected rates. We will use Docker setup, which includes simulation OPC UA Server from Microsoft, Docker image for which is available at https://hub.docker.com/_/microsoft-iotedge-opc-plc. Desription states that this server generates “random data and anomalies”.
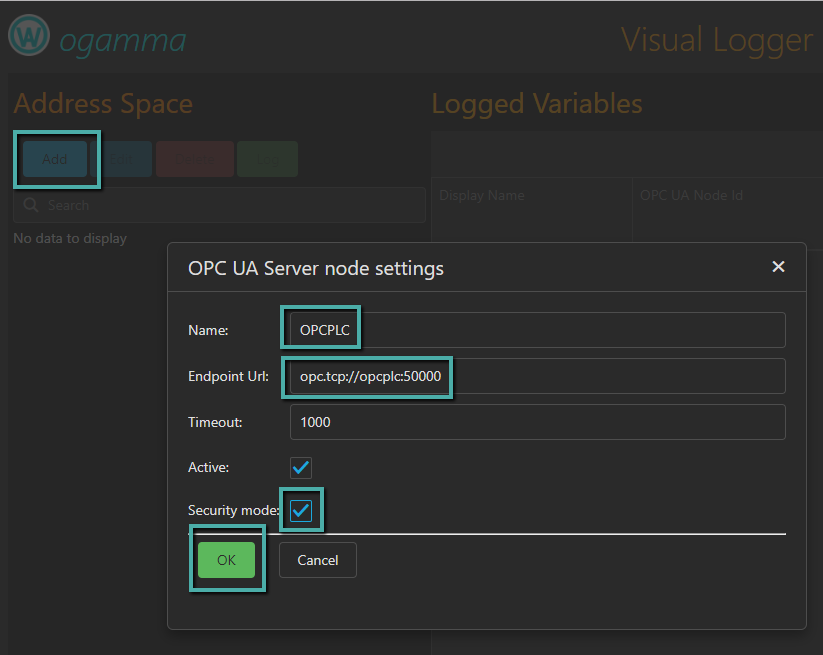
Step 1: Add server node into Address Space.
In ogamma Visual Logger for OPC Web GUI, click on Add button and edit settings to connect to the instance of IoT Edge OPC UA PLC Server:
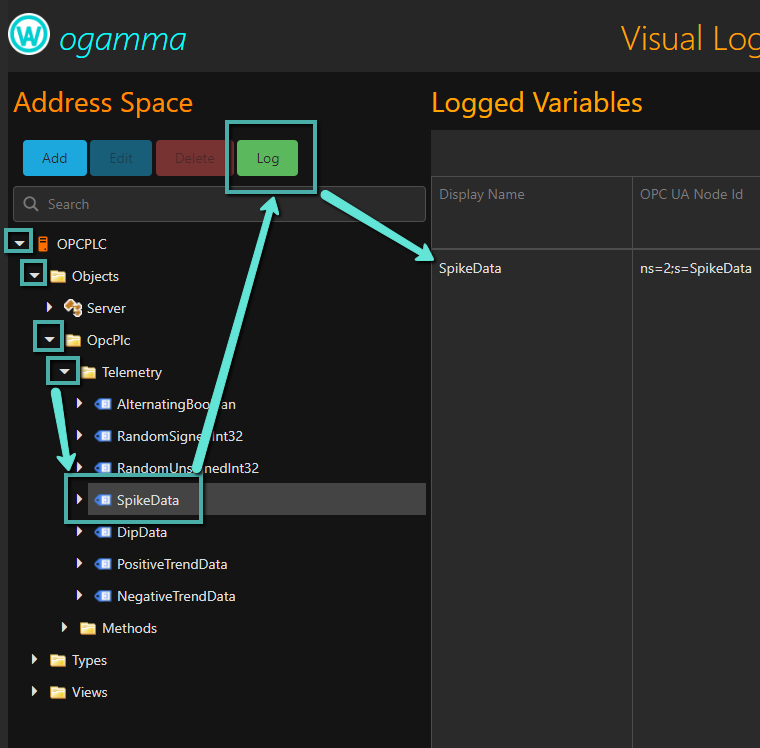
Step 2. Start logging of values for OPC UA variable node.
Browse OPC UA Server’s address space by expanding its nodes, select OPC UA variable node Objects/OpcPlc/Telemetry/SpikeData and by clicking on the Log button add it to the Logged Variables table:
Step 3. Configure Grafana panel to view data values
Add new panel of Graph type into the dashboard as shown in the screenshot below. If settings are correct, data values will start to be shown in the graph. Adjust time range and frequency of screen refreshing as required. Then by clicking on Go Back icon in the left upper corner of the Grafana page, return to normal view mode.

Step 4. Analyze data visually.
In Grafana you can select time range to display in the graph, as well as refresh mode. You can also select time range in the graph and zoom in it. After selecting proper time range, you can see every single data value in the graph, as in the example below.

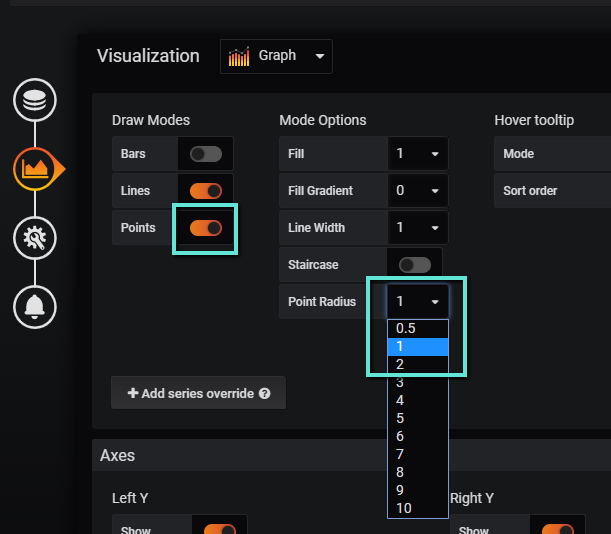
Note
To make data values easily visible, it is recommended to turn on feature to display points as show in the screenshot below:
Warning
Note that in the screenshot above data values are displayed 2 times per every second. This is not consistent with settings in the Logged Variables table: publising interval is 1000 ms and sampling interval is 1000 ms too there.
Having this in-consistency, lets continue analysis looing into values in the database.
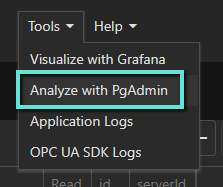
Step 5. Open PgAdmin page and connect to the TSDB database.
PgAdmin web GUI page can be opened from Tools menu, by selecting command Analyze with PgAdmin.
Note
PgAdmin page can be rendered not completely in some cases, seems like this might happen due to accessing its instance which runs within Docker container. If page is not displayed completely, you can try Miscrosfot Edge browser instead of Google Chrome. Or try to access it using IP address.
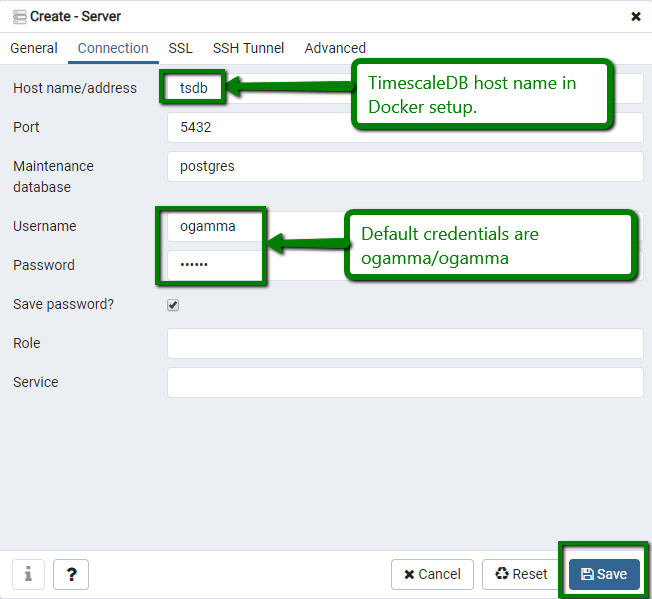
Expand node Servers in the Browser panel of PgAdmin, select Create/Server, and edit settings to connect to the TSDB server.

Once connected, you can browse database nodes:

Tip
You can also monitor some statistical data for the TSDB instance in this page, such as number of values written or read per second (Tuples In / Tuples Out)
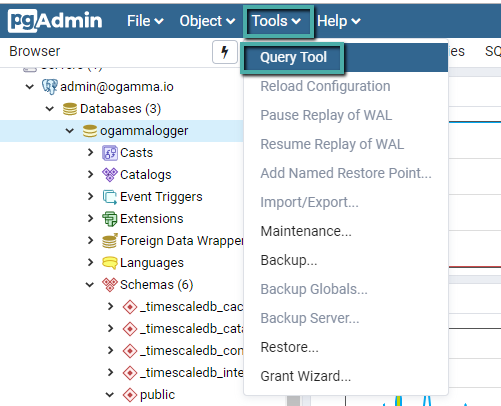
Step 6. Run SQL queries.
Now you can open Query tool and run SQL queries against TSDB data.
For example, to view data values for certain variable (which are identified by value in the table field sourceid, which is equal to values in the id column in Logged Variables table), you can execute query like:
SELECT * FROM VALUES WHERE sourceid=1 AND time>='2019-08-18 20:00:08' AND time < '2019-08-18 20:00:09';
Note
Values of the time field are in UTC timezone.
PgAdmin will return result similar to shown below:

You can also ask for number of values within certain time range by running query like this:
SELECT COUNT(*) FROM VALUES WHERE sourceid=1 AND time>='2019-08-18 20:00:08' AND time < '2019-08-18 20:00:09';
The result example is displayed below:

We can see that SQL queries also show that there are roughly 2 data values per second written in the database for this variable.
Warning
Why there are 2 values per second, when we expect only 1? Maybe server revises sampling interval to 500 ms instead of asked 1000 ms?
To continue investigation, you can use WireShark, capture TCP packets and analyze them.
Alternatively, you can look at OPC UA SDK level log files as well as ogamma Visual Logger for OPC application level log files, which can be opened via Tools menu. They can be accessed also from local host file system (subfolder data/logs).
Step 7. Look at log files for additional information.
Example of OPC UA SDK log file is displayed in the screenshot below. You can find revised values returned in the Create Monitored Items response, and can see that sampling interval 1000 ms was accepted by the server.

Step 8. Conclusion.
We have analyzed and came to conclusion that it is the server returning more values than expected.
As description of the server says, it has anomalies, so we assume that what we see is one of those anomalies which the server has.