Collect
This section describes how to configure connections to OPC UA Servers and selection of OPC UA variables to be accessible from Grafana and/or to log into the database.
To access cocnfiguration web GUI, open web browser, and navigate to the address http://localhost:4880
Note
Here and further below localhost is host name or IP address of the machine where ogamma Visual Logger for OPC is running.
Note
Web GUI of the ogamma Visual Logger for OPC is optimized and tested for screen resolution 1920x1080 in full size mode, in Google Chrome and Microsoft Edge. GUI layout might be disrupted in other combinations of the browser and screen resolution. If this becomes blocking issue for you, please report it at https://github.com/onewayautomation/ogamma-logger/issues.
Connections to OPC UA Servers.
To add new connection, in the left side panel, click on Add button.
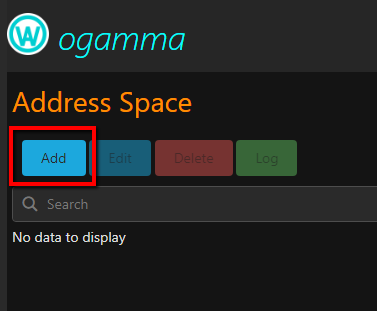
In the opened dialog window edit connection details as required and click OK.

Here field Timeout is connection timeout in milliseconds. Checkbox Active allows to turn on and off logging of variable values for this server to the database.
Field tag can be used for automatic generation of Topic Name for Confluent / Apache Kafka or MQTT or measurement for InfluxDB.
Note
OPC UA Servers should be accessible from the host (or Docker container) where ogamma Visual Logger for OPC is running. In case when it runs in Docker container, you might need to add option extra_hosts in file docker-compose.yml to resolve host name of the OPC UA Server to IP address.
Note
Default value in the Endpoint URL field (opc.tcp://opcuaserver.com:48010) points to the Demo OPC UA Server, which runs in the host avaiable from the Internet. It might be protected by firewall and allow connections only from IP addresses included into whilelist. If you cannot connect to it, please contact Support with IP address of your client (not local address like 192.168.x.x.m but the address how it is seen from the Internet, which you can determine by using sites like https://ipstack.com/)
Note
To connect to the OPC-PLC UA Server installed and running in the docker container (Endpoint URL opc.tcp://opcplc:50000/), please turn on check-box Secure mode, because it is configured to allow only secured connections.
Note
Currently web page is refreshed in order to refresh the Address Space tree after adding/editing/deleting of an entry for OPC UA Server connection.
Advanced connection settings.
Clicking on the button Edit Advanced Options opens dialog window, where other settings to connect to the OPC UA Server can be edited.

Periodical reading and logging of variable values.
Starting from version 2.1.5 it is possible to read variable values by calling Read request periodically and log read values to the time-series database, even if they are not changed. To enable this feature, use the following options in the advanced connection settings:
readValuesInterval: If this option is greater than 0, variable values will be read and logged periodically with this interval, defined in seconds. To read with sub-second intervals use fractions, for example to read every 100 ms enter0.1. The shortest interval used is 0.001 second (1 millisecond).nDefault value is 0.
maxNodesPerReadRequest: Used when the optionreadValuesIntervalis defined. If greater than 0, the number of variables in Read requests will be limited by the value of this option. For example, if this option is set to 100, and for the server 320 variables are logged, then these variable values are read in 4 read requests (100, 100, 100, and 20 variables per requests 1, 2, 3, 4 accordingly). Note that read requests are called sequentially. Default value is 0.
maxNodesPerBrowseRequest: Used when OPC UA server address space is discovered, to limit number of nodes to browse in Browse requests. Default value is 0, which means unlimited.
readValuesMaxAge: Used when the optionreadValuesIntervalis defined. Used to set option maxAge” of read requests, in milliseconds. Default value is 0.
Enabling support for complex type values.
ogamma Visual Logger for OPC can log variable values of complex data type, such as variable Objects/Server/ServerStatus. In cases if their values are logged in a format expanded to leaf nodes of simple type, or in JSON format, it is required to get from the server information about data type definitions. By default getting such information is disabled to keep connection process short. To enable it, change values of one or both options below to true:
readTypeDefinitionsOnConnect
readXmlTypeDictionaryOnConnect
Browsing OPC UA Server nodes with large number of child nodes.
Some OPC UA Servers have large number of nodes under the same parent. While the backend can handle quite large number of nodes, the frontend has much less performance rendering them, because it is implemented in JavaScript. Therefore number of references returned and duration of browsing are restricted by the backend, using configuration settings described below:
browseTotalReferences- when number of browsed references reaches this limit, results are returned to the browser, ignoring the rest of references. Default value is 1000. Note that value 0 is interpreted as default value.browseTotalDuration- limit for total duration of time to browse the node. Defautl value is 5000 (milliseconds).
If not all nodes are returned due to these limits, notification message is displayed. To add all variables in such cases, auto-discovery feature can be used.
Connecting in secured mode and certificates.
In order to connect to the OPC UA Server in secured mode, change value of the field Security mode in server settings accordingly.
For successful connection in secured mode both client and server sides should be configured to trust to each other’s application instance certificate.
Configure OPC UA servers to trust ogamma Visual Logger for OPC instance certificate.
By default ogamma Visual Logger for OPC generates a root CA certificate and then generates OPC UA application instance certificate signed by that CA certificate. Location of these 2 certificates by default is in the folder ./data/[InstanceId]/PKI/own/certs (relative to the working directory).
ca-cert.der- root CA Certificate.ca-cert.crl- the Certificate Revocation List, corresponding to the CA certificate, (CA CRL).public_Basic256Sha256.der- client application instance certificate.
In order for the server to accept the certificate of the ogamma Visual Logger for OPC, depending on the server, different actions might be required:
Configure the server to trust the root CA certificate. The application instance certificate will be trusted as a result too in this case. To establish such trust, usually root CA Certificate needs to be stored in the trusted certificates list in the server side. It can be downloaded via menu
Settings / Download Certificate / CA Certificate. Additionally the CA CRL (Certificate Revocation list) should be copied into the location expected by the server. CA CRL can be downloaded via menuSettings / Download Certificate / CA CRL.Alternatively, configure the server to trust the application instance certificate. Usually, application instance certificate should be stored in the trust list in server side. It can be downloaded via menu
Settings / Download Certificate / Application Instance Certificate. And additionally, CA certificate needs to be stored in the issuers certificates list too. If there is no separate location to store issuers certificates, then storing CA certificate in the trusted certificates list might be OK.
Configuring ogamma Visual Logger for OPC to trust to server instance certificates.
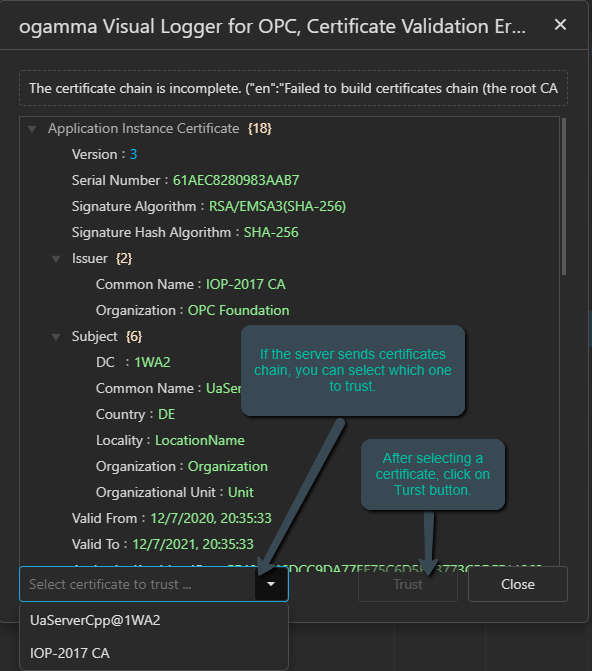
To configurure trust to the server certificate by ogamma Visual Logger for OPC, the easiest way is try to browse its address space by expanding server node in the Address Space panel. If the server certificate is not trusted, dialog window with certificate validation error will pop up, which also displays server certificate fields. You can review the certificate fields and then establish trust by clicking on the Trust button.
Note that if the server has sent the chain of certificates, then the first displayed certificate will be application instance certificate, and then it will have a child node with its CA certificate. You can select a certificate using the dropdown control located in the bottom left corner of the dialog window, and click on the Trust button. Note that if CA certificate is selected as trusted, then all certificates issued by that certificate will be trusted. If the chain has multiple CA certificates, then ones which are not selected will be added into the issuers list.
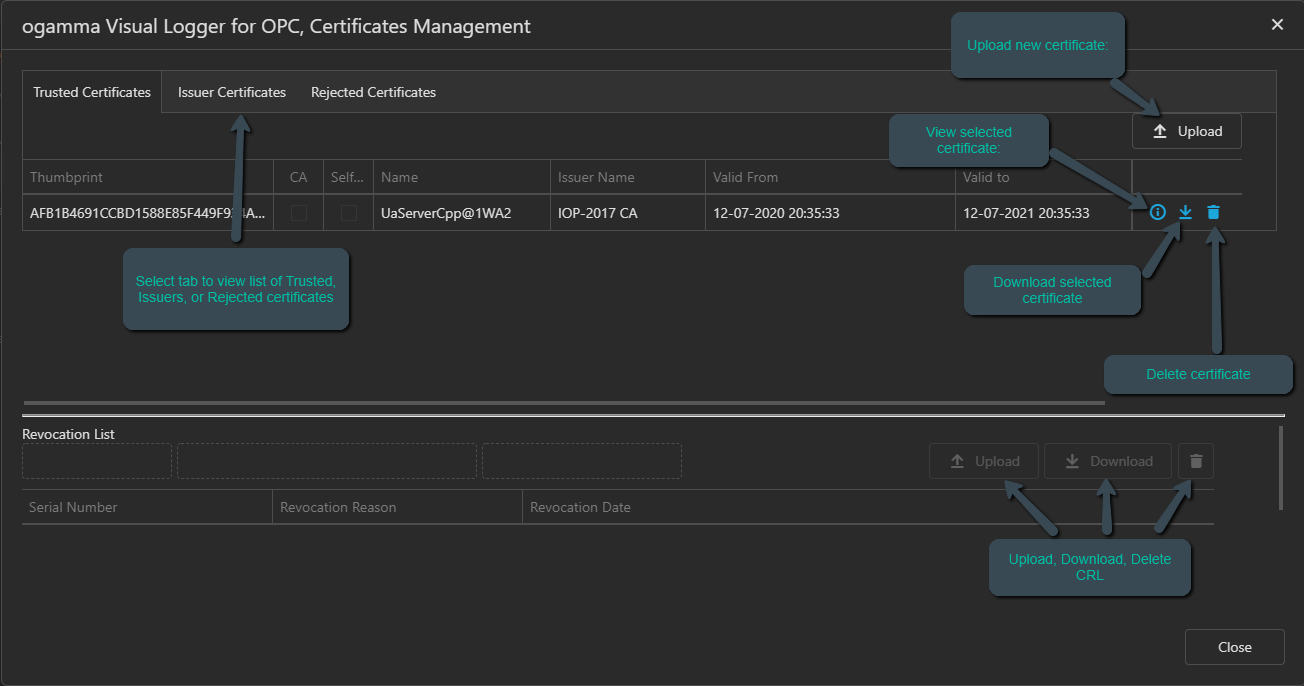
The list of trusted and issuer certificates as well as rejected server certificates can be viewed in Certificates Management dialog window (opened via the Settings menu). Here you can also upload certificates, downlod them, view their content, and delete them. It is also possible to upload certificate revocation lists, as well as download or delete them.
If the server certificate is not validated, it will be saved in the Rejected Certificates list. From this list, you can open the certificate to review it (by clicking on the View Certificate icon located in the right side of the line), and setup the trust from that window.
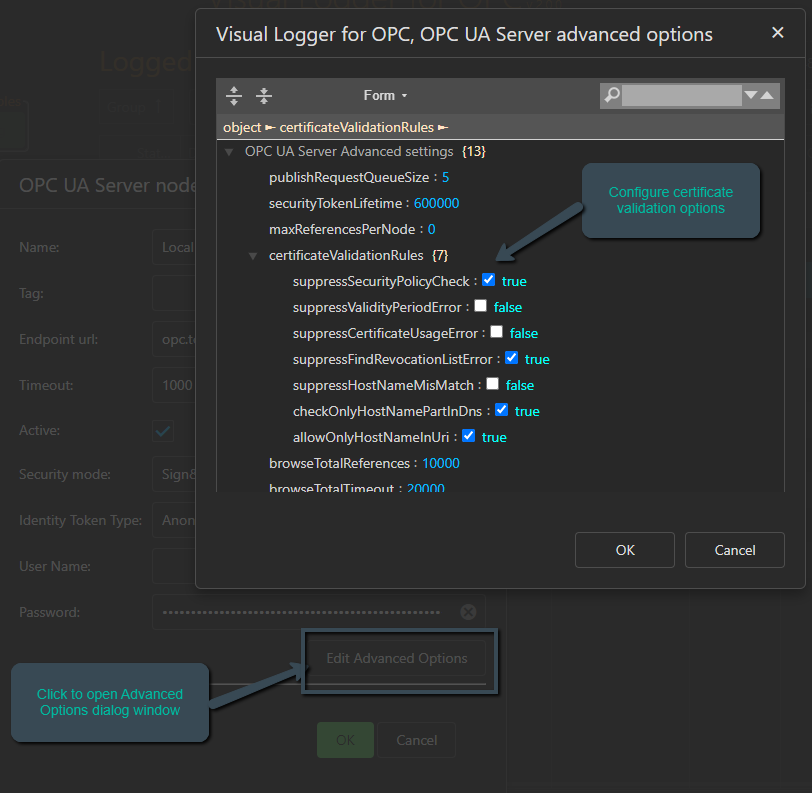
If the server certificate validation anyway fails, you can fine-tune validation rules by modifying advanced options as shown in the picture below. For example, if the server certificate is signed by a CA certificate, for which you don’t have a CRL, you can suppress error about missing CRL by turning on the checkbox suppressFindRevocationListError.
Connections from Docker container.
In case when ogamma Visual Logger for OPC is running within docker container, it is important to make sure that the machine, where the OPC UA Server is running, can be reached from the container.
For that, use either one of the following below approaches:
In the
OPC UA Server node settingsdialog window, fieldEndpoint URL, use IP address of the machine where the OPC UA Server is running, instead of host name.Or, in order to keep using host name in the Endpoint URL field, configure the ogamma-logger container to resolve it to the IP address, by adding following below lines (replace host name and IP address according to your setup):
extra_hosts:
 - 'opcuaserver.com:173.183.147.103'
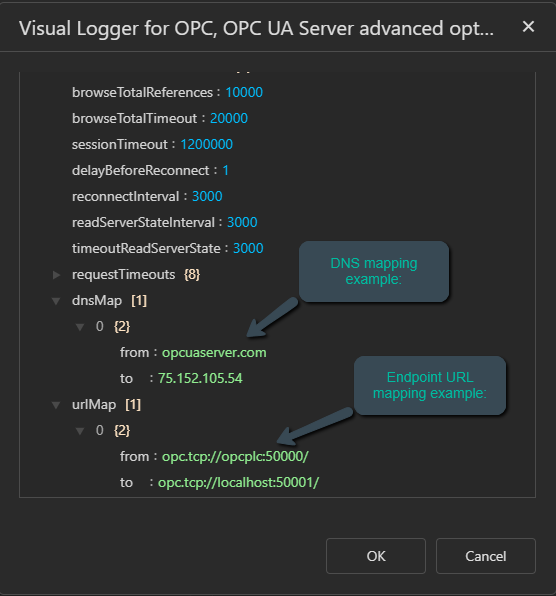
Connecting to OPC UA Servers running in Docker container, accessed over VPN or NAT or using port forwarding.
Often OPC UA Servers might be running behind firewall with port forwarding, or in a Docker container, or accessed over VPN or NAT. In all these cases it is possible that the server can be accessed over IP address or host name, which do not match with host name or IP address returned in the endpoint URLs in FindServers or GetEndpoints responses.
ogamma Visual Logger for OPC can handle most such cases, substituting host name or IP address returned by the server to the one defined in the original endpoint. But this can cause additional delays because it will first attempt to resolve the host name returned by the server. And in case if the server returns endpoint URL with different port number than it can be accessed using (for example in case of port number mapping in Docker containers), it becomes more complicated. To resolve such cases, in version 2.0.0 new connection settings are added accessible by clicking on the button Edit Advanced Options in the server node settings dialog. In the urlMap field you can enter arrays of pairs which are used to map endpoint URL returned by the server to desired substitute. For example, to connect to the demo OPC PLC server running in Docker container with service name (as well host name) opcplc, with endpoint URL opc.tcp://opcplc:50000/ (note the trailing backslash - it is required too), which is mapped to the Docker host’s port 50001, you can map it to opc.tcp://localhost:50001/.
It is possible also to map only host name part using the field dnsMap.
Connecting to classic OPC DA Servers.
If you need collect real time data from classic OPC DA Servers, it is possible too! There are various OPC DA to OPC UA protocol converter applications available in the market. Using them, data becomes accessible over OPC UA protocol. ogamma Visual Logger for OPC was tested with the following below applications:
Browsing OPC UA Server address space and selecting variables to log.
It is possible to select OPC UA Variables from the server to log in different ways:
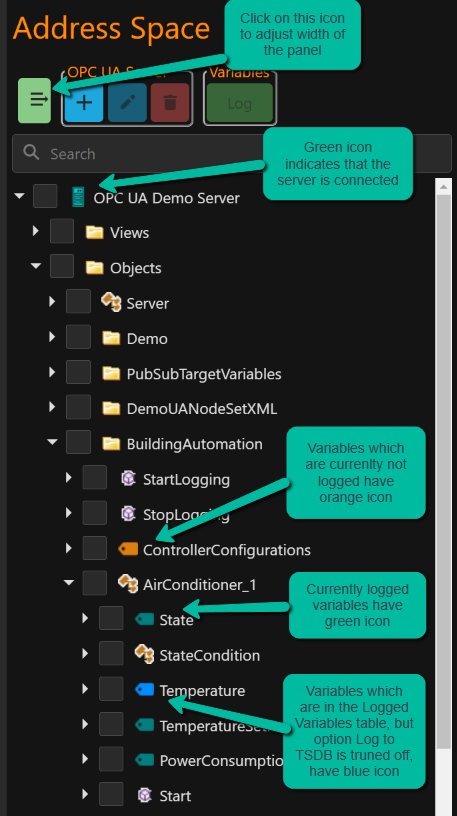
Manually by browsing the address space and selecting nodes from the Address Space panel using Web GUI:
Import from CSV file: Import variables from CSV file.
Using Python scripts to modify SQL configuration databases tables: How to add OPC UA Server connection settings and logged variables using Python scripts.
By direct access to the configuraiton database using SQL server management tools
Starting from version 3.0.0, it is possible to browse and select variables automatically: Auto-discovery and selection of variables.
Browsing and selecting of variables manually using web GUI.
To browse OPC UA Server’s address space, expand server node. Then select one or more OPC UA Variable nodes. Complex type values can be logged too, either without decoding (string representation in hexadecimal format), or decoded and presented in JSON formatted text. Storing of values in time-series databases can vary depending on the database type, for details please refer to data mapping sections for specific database.
Once one or more OPC UA Variables are selected, the button Log will be enabled. If you click on it, selected nodes will be used to create new records in the right side Logged Variables grid table.
Note
When variables selected in the Address Space panel added by clicking on the Log button to the Logged Variables table, options for them such as publishing interval, sampling interval, queue size will be set according to corresponding valus in the currently selected (default) Variables Group.
Tip
To select or un-select (toggle) selection flag for range of nodes, click by mouse on the selection checkbox for the first node, and then scroll up or down to the last node of desired range, and keeping pressed the Shift key, click on the last node’s selection checkbox. Whole range of nodes will be selected. If selection of the range does nto work, make sure that the option Rate (GUI control to the right from Refresh Data button) is set to value Off.
Note
If number of variables is too large (greater than 5000), it is recommended to consider adding that large number of variables either by direct access to the configuration database or using Python scripts, as it is described in the How To section of this User Manual. In case of anyway using the GUI, then please note that although actual broswing of the OPC UA Server address space by the backend is relatively quick, updating of the Address Space panel on the browser side can take considerable time (up to several minutes). It is recommended to select and add no more than 2000 nodes at a time, otherwise “unspecified network error” might occur. Please also note that when the range of auto-selected nodes has thousands of nodes, it can also take minutes to complete selection process (that is, to toggle selection checkbox in front of variable nodes).
Auto-discovery and selection of variables
This feature was added in version 3.0.0. In general it is hard to predict what variables customers would like to log. One option is to log every variable. But this might be not suitable in many cases. Also, it is possible that for different variables data logging parameters (such as sampling interval) should be different. To provide level of flexibility suitable to cover as much as possible use cases, ogamma Visual Logger for OPC uses Python scripts with the logic deciding what nodes should be browsed, and what variables should be logged. The autodiscovery workflow in essence is implemented by the following below steps.
Starting from the node selected in the
Address Spacepanel, OPC UA address space is browsed.The browse result (in terms of OPC UA,
Reference Descriptions) might have some variables as well as other type nodes such as objects.For received browse result, 2 types of Python scripts called:
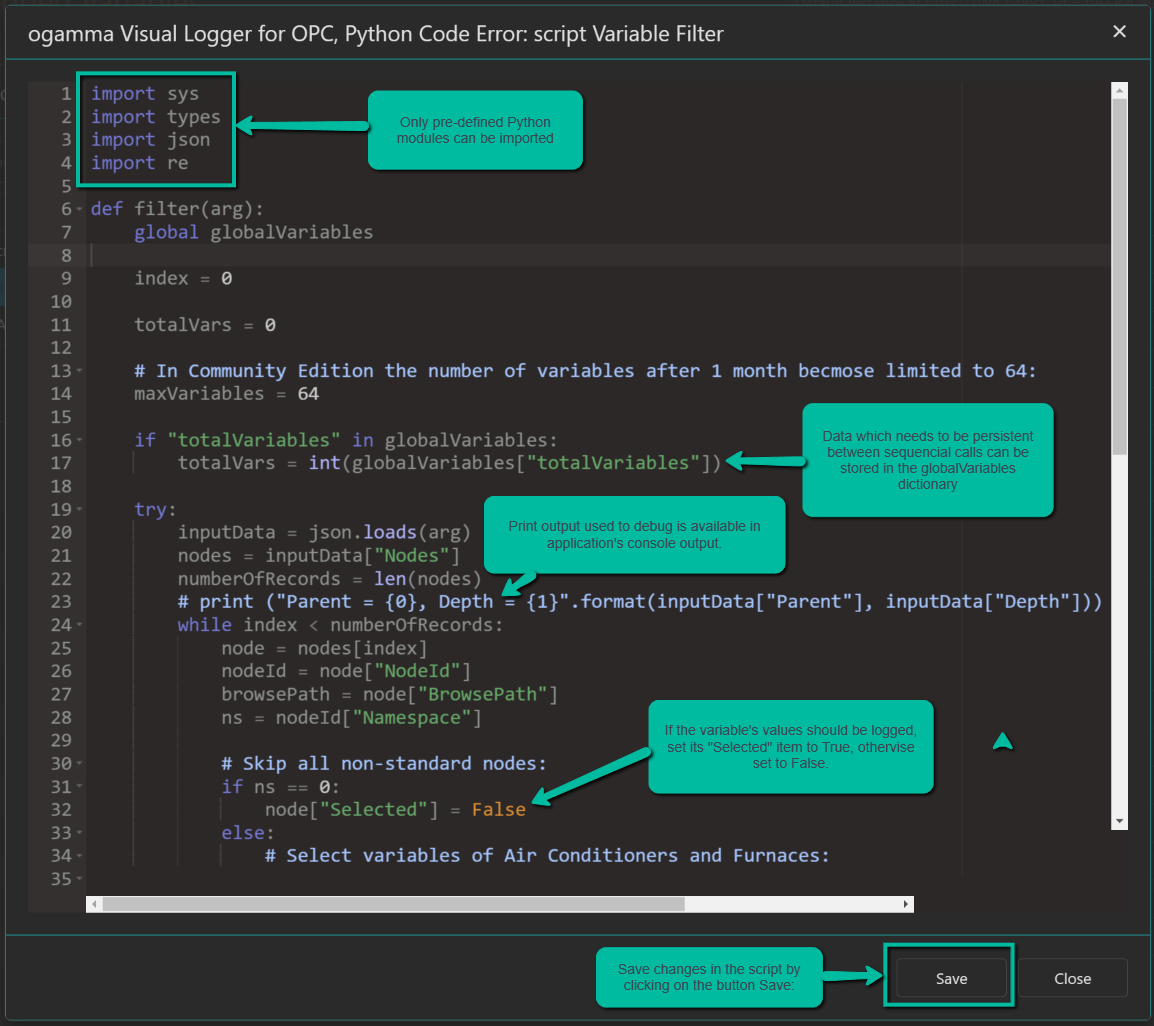
Variable Filter Scriptis called by passing the list of variable nodes (with attributes such asBrowse Path,Display Name,OPC UA Node ID) from this browse result, and with additional information about the parent node. In the script it is possible to set for each variable the flag indicating weither the variable should be logged or not. Also it is possible to set logging parameters, including OPC UA monitored item parameters as well as parameters used on records logged to the destination database such as MQTT or Kafka topics.Browse Filter Script- it is called with list of nodes in the browse result, and should return boolean array with the same length and the same order, as the list of nodes passed to it. If value of the element corresponding to the node isTrue, then that node will be browsed further down.
To see exactly what parameters are passed and what is returned, you can view browser log file (click on the icon to the right from the Log script call arguments checkbox, which should be checked in order to log input and output arguments). You can also confugure debugging of Python script codes with Visual Studio Code (as described in the next section), set breakpoints in the script files and see variable’s structure and values in debugger.
Python scripts are stored in the Scripts table, which can be accessed from the main menu Settings / Scripts, or from the dialog window Browse and select variables to log, by clicking on the icon to the right from the script selection drop-down field. Once the script debugging is complete, logging can be turned off for better performance. When scripts are saved via ogamma Visual Logger for OPC configuration GUI, their copy is saved in the filesystem too. When the script content is edited via ogamma Visual Logger for OPC configuration GUI, the newest version is displayed on the GUI: from the file system or from the configuration database. This way version of the script in a file is kept in sync with the database version. Having script files in the filesystem allows to manage change history and control different versions using solutions like Git.
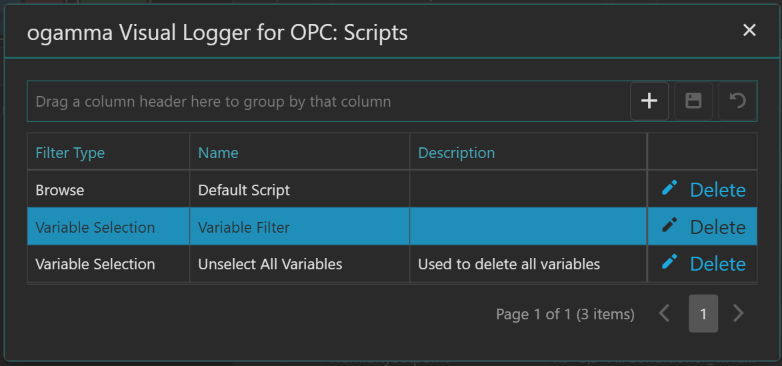
By default the Scripts table includes three scripts which are used as example to select variables from the Unified Automation OPC UA Demo Server’s Objects/ BuildingAutomation node.
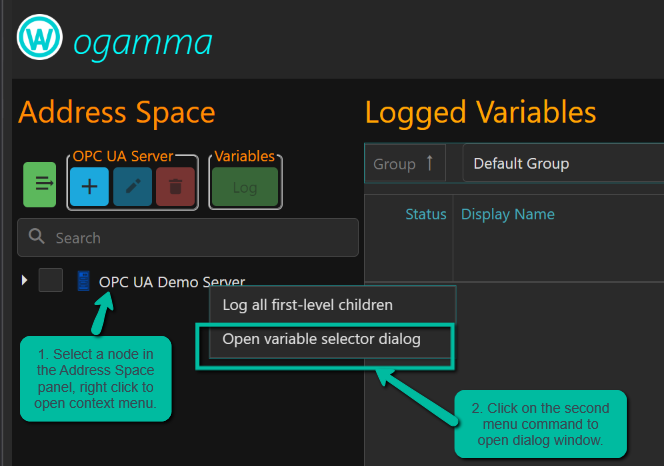
To access the auto-discovery feature:
add OPC UA Server connection node to the
Address Spacepanel.select a node starting from which you would like to discover variables. Can be server’s root node, or any other node.
open context menu by clicking right button of the mouse.
select menu command
Open variable selector dialog. As a result, dialog windowBrowse and select variables to logwill be opened.
In dialog window Browse and select variables to log select scripts to filter browsing results to continue browsing, and to filter variables. Also, select the Variable Group - monitoring parameters such as Sampling Interval will be copied from it. You can limit how deep the browsing can continue. Then set values of checkboxes defining what to do with the selected nodes - to add variables which are not logged yet, or update or delete existing logged variables. Note that any variable with a given OPC UA Node Id can be logged only once.

Once auto-discovery settings are configured, click on the Start button. Under the Statistics group, current state of browsing process and number of discovered / selected nodes will be displayed.
After completion of the browsing, depending on selected actions, the button Add/Update/Delete variables becomes enabled and its text changes showing number of affected variables.

To delete existing logged variable records, select different variable selector script as shown in the screenshot below.

Debugging Python scripts
Starting from version 4.1.0, it is possible remotely debug Python scripts used to auto-discover variables on OPC UA Servers. This is implemented using debugpy module.
To enable Python debugger, environment variable OVL_PYTHON_START_DEBUGGER should be set to value ON. When enabled, Python interpreter starts to listen on the port defined by environment variable OVL_PYTHON_DEBUG_PORT (default value is 5678), when browse or variable filter is called first time. By default Python debug server listens on all network interfaces. To listen on specific interface, environment variable OVL_PYTHON_DEBUG_HOST can be set to value of the IP address, for example, 127.0.0.1. To listen on all interfaces, set it to the default value 0.0.0.0 (note, the value should be without quotes, for example, the command to set the environment variable in Linux would be like: export OVL_PYTHON_DEBUG_HOST=0.0.0.0).
Starting from version 4.1.3, environment variables OVL_PYTHON_START_DEBUGGER and OVL_PYTHON_WAIT_FOR_CLIENT are overriddend by options Turn On Python Debugger and Wait for Debug Client in the dialog window Browse and select variables to log of the configuration GUI.
As a debug client, Visual Studio Code can be used with Python Debugger extention. To debug with it, open sub-folder ./data/[InstanceId]/python-scripts under working directory of the ogamma Visual Logger for OPC (here [InstanceID] is Visuall Logger instance ID, with a value like E7CBD5BC6632EB9B). Note that the OVL saves copies of Python scripts in this folder when these scripts are saved via ogamma Visual Logger for OPC configuration GUI.
When debugging is started, Visual Studio Code will ask to create configuration for the debug session in file ./.vscode/launch.json (relative to the folder opened by Visual Studio Code). When you create a new configuration entry, select Python Debugger / Remote Attach from the dropdown lists. And then select remote host name and port number.
In that debug configuration file, configure the section pathMappings:
localRoot- a folder where to look for Python script files in the machine where Visual Studio Code is running. Can be kept with defualt value${workspaceFolder}.
remoteRoot- this is a folder where copies of Python scripts are saved by the ogamma Visual Logger for OPC. In case of running in Docker, it will be in format:/home/ogamma/logger/data/E7CBD5BC6632EB9B/python-scripts, whereE7CBD5BC6632EB9Bis instance ID (its value can be found on the ogamma Visual Logger for OPC configuration GUI below main menu.)
To wait for the debug client connection before running of Python scripts, turn on the options Turn On Python Debugger and Wait for Debug Client. Note that they can be changed only once after application start. If you need to change them, application restart is required.
Here is the example of Visual Studio Code debugger configuration file ./.vscode/launch.json:
{
        "version": "0.2.0",
        "configurations": [

                {
                        "name": "Python Debugger: Remote Attach",
                        "type": "debugpy",
                        "request": "attach",
                        "connect": {
                                "host": "localhost",
                                "port": 5678
                        },
                        "pathMappings": [
                                {
                                        "localRoot": "${workspaceFolder}",
                                        "remoteRoot": "/home/ogamma/logger/data/E7CBD5BC6632EB9B/python-scripts"
                                }
                        ]
                }
        ]
}
Note
Note that the folder name in the option remoteRoot must be defined as absolute path. In the example shown above its value is for the case when the ogamma Visual Logger for OPC is running in Docker container.
Mote that Python scripts are stored in the ogamma Visual Logger for OPC configuration database. If database version of the script is not synchronized with the copy in the file system, breakpoints might not work properly. To make script copy appear in the file system in the folder ./data/[InstanceId]/python-scripts the script should be opened via ogamma Visual Logger for OPC menu command Settings/Scripts, and saved. You can also edit a script in Visual Studio Code and save it. When the script is used in discovery process, changes saved from Visual Studio Code will be syncronized with the database version.
Note that name of the script file is composed as name of the script in ogamma Visual Logger for OPC, with added postfix .py.
Once Visual Studio Code is connected to the debug server, you can open a script file, set breakpoints in it, and then start variable selection process. That will cause running of the script code by the Python interpreter, and when a breakpoint hits, you can see varaible values, run the code step by step as in a usual debugger.
Note that it is possible also to run Visual Studio Code via web GUI - details will be added to this User Manual later.
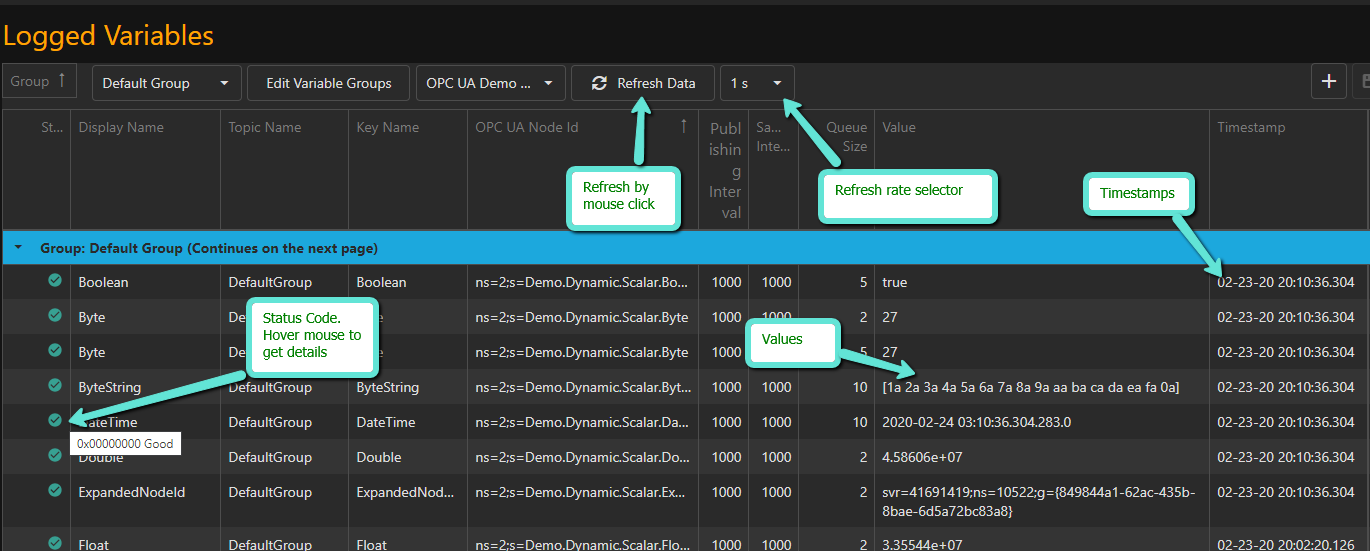
Logged Variables table.
Logged Variables table defines list of OPC UA Variables for which values are collected and logged into time-series database. Some features of the table are highlighted below.
Columns.
Order of columns can be changed by drag and drop.
Visibility of columns is configurable: click on the
Column Choosericon to select what columns to display.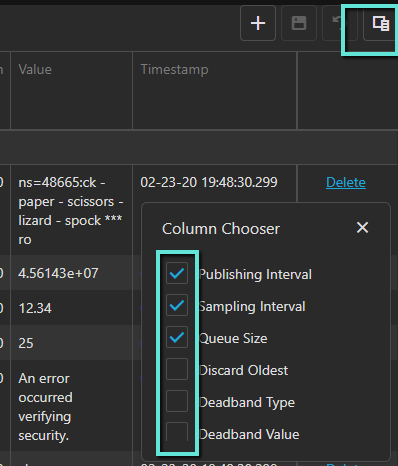
Sorting by most columns is possible: click on the column header in order to sort by that column.
Grouping of logged variables
Grouping by one or more columns is possible. In order to group by a column, drag column header and drop it into the grouping area:
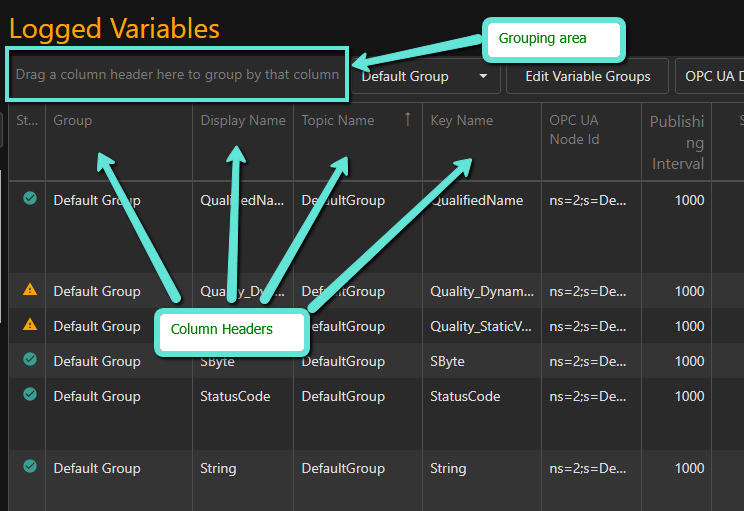
Groups and sub-groups can be collapsed or expanded:
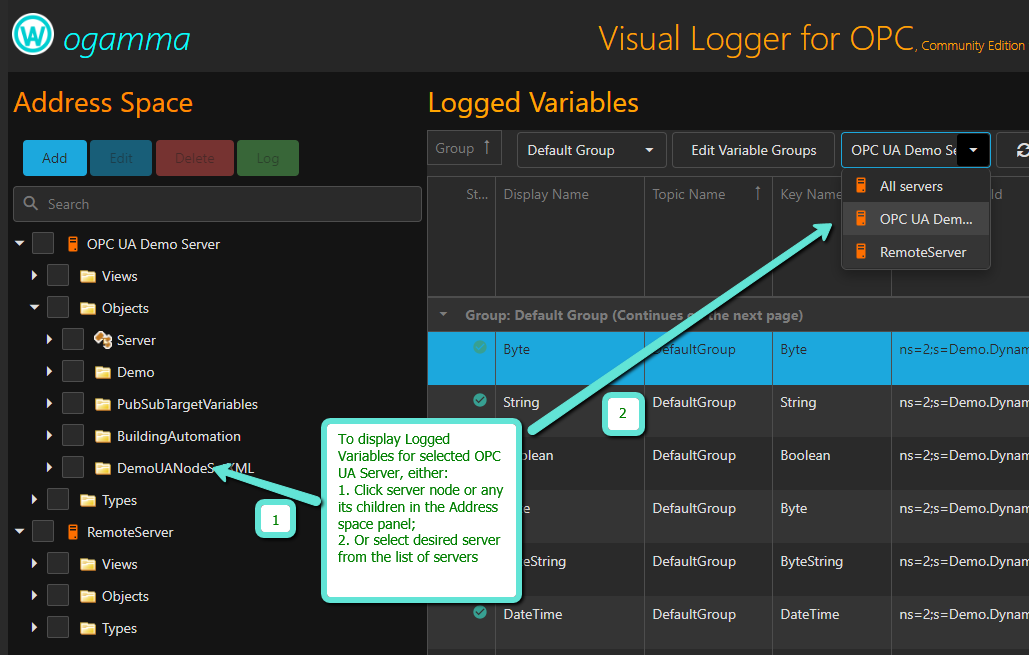
Filtering by OPC UA Server.
Only Logged Variables belonging to selected OPC UA server can be displayed, or all of them:
How to set default values for logging options.
Default values for new records added to the Logged Variables table from address space panel can be set by selecting of a group with desired logging options:

Display real time data.
Collector Engine keeps the last value received from OCP UA Servers in the in-memory buffer. Those values can be displayed in the Logged Variables table in the Value column, with OPC UA Status code (in Status column) and timestamp (in Timestamp column).
Other options.
Short description for other columns can be displayed by hovering the mouse pointer on the column header. Description of some of them follows below.
Sampling IntervalandPublishing Intervalcolumn values are type of floating point, defined in milliseconds. To collect data with sub-millisecond intervals enter values with fractional part, for example, for the interval100 microseconds, enter value0.1. Sampling interval value -1 means to sample with the same rate as publishing interval.If a record has field
Log to TSDBchecked, then its value will be monitored by ogamma Visual Logger for OPC, and written (logged) into the time-series database.Column
Get History fromdefines where data values should be read from when SimpleJson requests from Grafana are processed:TSDB(time-series database) orOPC UA Server.
If data values should be read from OPC UA Server, then how it is read depends on value of the column Read Type: Read means call Read service, and HistoryReadRaw means call HistoryRead service.
Column
Display Nameis displayed on Grafana when variable is selected as a metric for SimpleJson data source:
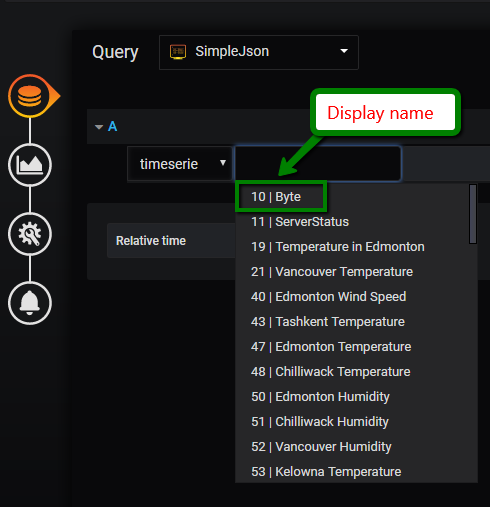
The Display Name also can be used to generate topic/measurement/tags for records written to the TSDB.
Records in the
Logged Variablestable can be edited and deleted, as well added manually.
The following below screenshot illustrates typical GUI with brief comments on available controls:

Tip
If you want to log data for hundreds or thousands of nodes, it might be time consuming to configure variables using the GUI. For those cases, you can prepare your data in Excel spreadsheet or other tools in CSV format, and then import into ogamma Visual Logger for OPC configuration database, table loggingNodes, using database management tools.
Client-side deadbands.
Often OPC UA servers support the so-called deadband feature to filter out noise level data changes. The deadband can be of 2 types: absolute and percent. For a detailed description of the Deadbands, refer to the OPC UA Specifications (https://reference.opcfoundation.org/v104/Core/docs/Part4/7.17.2/ and https://reference.opcfoundation.org/Core/docs/Part8/6.2/).
Deadband settings are configured by settings values in columns Deadband Type and Deadband Value.
If the server does not support the deadband feature, it can be implemented on the client-side. For that, in the Edit Advanced Options dialog window uncheck the option supportsAbsoluteDeadband or supportsPercentDeadband respectively to apply client-side absolute or percent deadband. In case of the percent type deadband, value of the EU Range used to calculate the change in percents, is defined in the column with the same name.
Logging values of complex data type.
Values of OPC UA variables with complex data type can be logged into the InfluxDB type time-series database starting from version 2.1.0. Logging values of those variables is implemented in the same way as for other variables: they can be selected in the Address Space panel and added to the Logged Variables table by clicking on the button Log.
Complex type values can be stored in 3 different ways, depending on the setting of the column Store Mode in the Logged Variables table:
Encoded- whole data value is stored in original OPC UA binary encoded format, converted into Base64 string.
JSON- data value is expanded into pritimite type fields, and stored as JSON string (default setting).
Expanded- data fields are expanded up to primitive type values, and each member field value is logged individually. In this case also it is possible to configure for each leaf member field the deadband settings, and turn on and off logging for that field. Logging inExpandedmode allows to save on database storage and network bandwidth in cases when most members of the complex type value are static and only few members change often. For example, standard variableObjects/Server/ServerStatushas only one member field changing:CurrentTime, other fields are static.Note
Logging in
Expandedmode is supported only for InfluxDB.Those settings can be configured in the JSON editor dialog window, which is opened by clicking on the settings icon located in the buttons column, as shown in the screenshots below. To compose default settings, enable server connection for the variable so its current value can be read, and enable displaying of real time data values or click on the
Refresh Databutton. If complex type value is read successfully and could be decoded, default settings will be created with logging of all nodes set to Off and deadband type set to None. After editing filter fields and closing JSON editor dialog window, click on theSaveicon localted on the top right area of theLogged Variablestable to save changes. To disable applying these filters, switch the JSON editor mode toTextmode and enter filter value{}. To populate the filter settings with default values switch the JSON editor into Text mode, clear the content completely, and save changes. After refreshing of real time data the filter settings will be set to default values.

Tip
To view real-time values of complex type variables in JSON format, in the Logged Variables table use column chooser to make the column Expanded value visible.