How to:
This section is under development.
Modify minimal refresh rate for Grafana
By defaylt, in Grafana 7 refresh rate for dashboard cannot be set to lower than 5 s. Whiel in production environment this might be good feature to avoid undesired too high load on the system, during development and testing it is often better to have faster refresh rates.
Minimum refresh interval can be modified in Grafana configuragion file grafana.ini, which might be located in different places depending on your deployment. Refer this page to find out locations: https://grafana.com/docs/grafana/latest/administration/configuration/#config-file-locations
In case of Docker, configuration file is not accessible easily from the host machine. In this case it can be copied to the host machine, modified, and then copied back to the container. Example steps are described below:
Open command line terminal
Copy file from container to the host machine:
docker cp ogamma-logger_grafana_1:/etc/grafana/grafana.ini .Modify setting
min_refresh_intervalto desired minumum value.Copy file back to the container:
docker cp ./grafana.ini ogamma-logger_grafana_1:/etc/grafana/grafana.iniRestart the container.
How to enable SQL Server Authentication and TCP in Microsoft SQL Server Express
The ogamma Visual Logger for OPC connects to Microsoft SQL servers (including Express version) using SQL Server Authentication mode, over TCP connection. When you install MS SQL Server’s Express version, by default both of these options are disabled.
Enabling SQL authentication Mode.
To enable SQL Server Authentication mode, the Microsoft SQL Server Management Studio can be used. It is installed separately from SQL Server Express. With it, connect to the SQL Express instance using Windows Authentication mode, then select this connection node in the Object Explorer and open context menu by mouse right click. Then click on the Properties menu command, and open Server Properties dialog window. There, in the left side panel select Security page and set option Server Authentication to SQL Server and Windows Authentication Mode.
Also you can enable default user sa if it was disabled. For that, in the Object Explorer panel expand the Security node, and Logins node under it, and under it select the node sa. Open its Properties dialog window (by using context menu), select Status page, and set the option Login to Enabled.
You can also reset password for the sa user. Or add other users as required.

Enabling TCP connections.
To enable TCP connections, SQL Server Configuration Manager can be used (it should be installed when the MS SQL Express is installed. If you type SQL in the Windows search field, it should appear in the found applications list.
In its left side panel, find node SQL Server Network Configuration / Protocols for SQLEXPRESS. If you have multiple instances running, there might be multiple nodes under the SQL Server Network configuration node - select the desired one.
In the main panel, select node TCP/IP, and open its Properties dialog window. In the Protocol tab page, set option Listen All to Yes.

In the IP Addresses tab page, scroll down to the IPAll node, and clear TCP Dynamic Ports field, and set TCP Port to 1433 (or other port if it is used by another instance of the SQL Server). You can also set settings for each IP address separately.

To apply modifications restart the MS SQL Server service (for that you can use either SQL Server Configuration Manager or Microsoft SQL Server Management Studio).
Enable horizontal scrolling in the Logged Variables table.
In the version 2.0.0 and later horizontal scrolling should be enabled. If it is not, this might be due to the cached settings, saved in the previous version. To clear the cache in Google Chrome, open developer tools (Settings / More tools / Developer Tools), select Application tab, and delete Local Storage entries for the URL of ogamma Visual Logger for OPC web GUI.
Upgrade time-series database from InfluxDB 2.0 Beta version to InfluxDB 2.0.3 released version.
Upgrading InfluxDB from 2.0 beta version to 2.0.x release version is not automatic, requires some manual steps. Therefore this HowTo section is created to describe the upgrade process step by step.
Warning
This HowTo guide is applicable only in case if databases are running in Docker containers, and you are using InfluxDB 2.0 beta only to store data and not using dashboards, tasks, alerts. If you need to upgrade and transfer not only data but also all other settings (dashboards, tasks, alerts), refer to the guide provided by InfluxData at https://docs.influxdata.com/influxdb/v2.0/upgrade/v2-beta-to-v2/
Prepare new docker-compose file, which uses new version 2.0.3 of the InfluxDB. You can use file
influxdb2.0.3.ymlfrom GitHub repository https://github.com/onewayautomation/ogamma-logger (in folderdocker). Start container and configure instance of the InfluxDB 2.0.3 to use the same settings for organization and bucket, where the OVL was storing data in InfluxDB 2.0 Beta version. You can use configuration web GUI of the InflxuDB 2.0.3 to configure these settings, which is available over URLlocalhost:8016in case of using this docker-compose file.In ogamma Visual Logger for OPC, create new TSDB connection of type “InfluxDb 2.0” for Influx 2.0.3 release version. Configure all settings (measurement, tags, buckets etc.), but do not enter token yet in the
Passwordfield, clear it and leave empty. This is required to prevent ogamma Visual Logger for OPC connecting to the InfluxDB before completion of the upgrade. If you click the buttonTest Connection, it should show that the connection status as OK, because during this testing it does not try to write data yet.
Note
The released version 2.0.x of the InfluxDB uses port number 8086 by default, not 9999 used by the beta version. In case of using Docker compose file
influxdb2.0.3.yml, host name in the TSDB settings should be set toinfluxdb2.0.3.
Modify settings for the instance (via menu
Settings/Instances, selecting current instance and opening it for editing) to use the database IndluxDB 2.0.3 configured in the previous step.
After this, refresh OVL configuration GUI web page and verify that in the
Logged Variablestable columnsMeasurementandTagshave correct values. If they have incorrect values, then revise Measurement generation mode and Tags Generation Mode settings and JSON field settings in the InfluxDB 2.0.3 configuration settings.Also, open Statistics dialog window via menu
Tools/Statisticsand verify that theTSDB Statusfield displays connection error message.Collected data will be stored in the Local Storage buffer now.
Connect to the InfluxDB 2.0.3 container’s terminal:
docker exec -it ogamma-logger_influxdb2.0.3_1 bashHere
ogamma-logger_influxdb2.0.3_1is container name.
Export data from InxlusDB 2.0 Beta container (connecting to it remotely), and import data to the InfluxDB 2.0.3:
Export from InxluDB 2.0. Beta:
influx query 'from(bucket: "ogamma") |> range(start: -3y)' -r --host http://influxdb2:9999 -o ogamma -t secrettoken > data.csvHere option -o defines organization, option -t - authorization token. You might need to adjust these values.
Note
Export and Import can take significant time if database has large amount of data.
Import to the InfluxDB 2.0.3:
influx write --format csv -o ogamma -b ogamma -f data.csv -t secrettokenExit from container terminal by running command
exit.
Verify that data is imported into InfluxDB 2.0.3. This can be done by connecting to its GUI and running queries, or via Grafana.
In ogamma Visual Logger for OPC GUI, set correct authorization token for the InfluxDB 2.0.3 database.
Verify that data is being stored into the new database: in the
Settings/Statisticsdialog windowTSDB Statusfield should displayconnected, and number of stored values should be increasing, and fieldBalanceshould display small number of values left in the Local Storage.
Stop InfluxDB 2.0 beta version.
If all previous steps were completed successfully, in the Docker host machine, run command:
docker-compose -f influxdb2.0.yml downNote
This command might report an error
error while removing network, which can be ignored.
How to solve issue with duplicate records in SQLite or PostgreSQL/TimescaleDB.
To optimize read access to the time-series values stored in PostgreSQL or TimescaleDB, you might want to create additional index let say by sourceid and time columns.
Assuming that for each variable just one value is reported by the server, you might want to make this index unique.
This kind of index can be created by running SQL query:
In SQLite:
CREATE UNIQUE INDEX values_index_sourceid_time on public."values" (sourceid, time);
In PostgreSQL:
CREATE UNIQUE INDEX IF NOT EXISTS idx_time_sourceid ON values (sourceid, time);
In most cases this does not cause problems. But if there are logged variables which do not change too much, it is possible to get error about duplicate records, if the ogamma Visual Logger for OPC restarts, or server connection is deactivated for some time and re-activated again. The point is that after re-connecting to the server, it reports last sampled values for all variables. And because the variable did not change since it was last time written to the database, this value reported by the server will be duplicate. Note that in the time column an OPC UA Source Timestamp is written, which means the time when it was last changed in the server, not the time when it was reported.
To eliminate this error case:
With SQLite database, you can change JSON option ‘’insertSqlCommand`` to
INSERT AND REPLACE.With PostgreSQL/TimescaleDB, in version 2.1.0 new option was addded:
insertPostFix. If you set it, for the index example given above, to valueON CONFLICT (sourceid,time) DO NOTHING, the database will ignore duplicate records without reporing errors. To apply this option, turn on another optionapplyInsertPostFix.
Note
If ogamma Visual Logger for OPC was upgraded from older version, where index did not exist, attempt to create the index can fail if there are already duplicate records in the database. Existence of the index is checked at every start of the application, and failure on the index creation step can cause connection failure. In this case either initialization script should be modified (to not try to create the index), or duplicate records should be deleted using SQL server management tools. Before making any changes in the database, it is recommended to create a valid backup of the database.
Example of the SQL script which can be used to eliminate duplicate records in the PostgreSQL table values follows below. It creates new table values_copy with the same structure as table values, copis to it unique records from original table, then deletes original table and renames new table name to values. Note that when database is large, running it can take long time.
CREATE TABLE public."values_copy" ( LIKE public."values");
INSERT INTO public."values_copy" (SELECT DISTINCT ON(sourceid,time) * FROM public."values");
CREATE UNIQUE INDEX IF NOT EXISTS idx_time_sourceid ON values_copy (sourceid, time);
DROP TABLE public."values";
ALTER TABLE public."values_copy" RENAME TO values;
CREATE UNIQUE INDEX values_index_sourceid_time on public."values" (sourceid, time);
How to install and run InfluxDB.
Windows 10
Open PowerShell terminal and navigate to the folder where InfluxDB and databases should be located.
Download open-source version:
wget https://dl.influxdata.com/influxdb/releases/influxdb2-2.0.6-windows-amd64.zip -UseBasicParsing -OutFile influxdb2-2.0.6-windows-amd64.zip
Extract into current folder:
Expand-Archive .\influxdb2-2.0.6-windows-amd64.zip -DestinationPath './'
Run, with databases created under the current folder, sub-folders
boltandengine:
influxd.exe --bolt-path=bolt --engine-path=engine --http-bind-address :8086
Linux (Ubuntu 18.04)
wget https://dl.influxdata.com/influxdb/releases/influxdb2-2.0.7-linux-amd64.tar.gz
tar xvzf ./influxdb2-2.0.7-linux-amd64.tar.gz
cd influxdb2-2.0.7-linux-amd64
./influxd --bolt-path=bolt --engine-path=engine --http-bind-address :8086
The InfluxDB now should start, and its web interface should be avaibale at port 8086.
Installing SSL certificates from letsencrypt for InfluxDB (Ubuntu)
Free SSL certificates can be obtained from https://letsencrypt.org/ This can be automated in different ways, below are steps for one of them.
For more details you can refer to those materials:
https://serverspace.io/support/help/how-to-get-lets-encrypt-ssl-on-ubuntu/
https://certbot.eff.org/docs/using.html#where-are-my-certificates
Commands below should install the certbot application, verify that the certbot service is running, and get certificate for domain influxdb2.opcfy.io:
sudo apt install -y letsencrypt
sudo systemctl status certbot.timer
sudo certbot certonly --standalone --agree-tos --preferred-challenges http -d influxdb2.opcfy.io
The certificate and key file will be located at:
/etc/letsencrypt/live/influxdb2.opcfy.io/fullchain.pem
/etc/letsencrypt/live/influxdb2.opcfy.io/privkey.pem
They will be accessible only for the root user by default. You will ned either run influxdb under root user, or change permissions for those files.
Enabling SSL for InfluxDB is simple, you just need to pass certificate’s public and private key file names in the command:
./influxd --bolt-path=bolt --engine-path=engine --http-bind-address :8086 --tls-cert=/etc/letsencrypt/live/influxdb2.opcfy.io/fullchain.pem --tls-key=/etc/letsencrypt/live/influxdb2.opcfy.io/privkey.pem
To monitor size of the InfluxDB database folder, the tool ncdu is convenient, which can be used from the terminal. It can be installed by command sudo apt-get install ncdu.
Running InfluxDB as Azure IoT Edge Module
Once Azure IoT Edge runtime is installed in the device and provisioned, you can install InfluxDB in it remotely using Azure Portal.
In the device page, click on the Set Modules tab page. In the IoT Edge Modules section, click on the Add button. In the dropdown list select IoT Edge Module. As a result, Add IoT Edge Module page should be opened.
Here, in the Module Settings tab, enter the following fields:
IoT Edge Module Name- arbitrary name of the module.
Image URI- set to the full URL of the Docker container image:registry.hub.docker.com/influxdb/influxdb:2.0.
In the Container Create Options tab, enter the following settings:
{
    "Hostname": "influxdb2",
    "Volumes": {
        "/var/lib/influxdb2": {}
    },
    "NetworkDisabled": false,
    "ExposedPorts": {
        "8086/tcp": {}
    },
    "HostConfig": {
        "PortBindings": {
            "8086/tcp": [
                {
                    "HostPort": "8086"
                }
            ]
        },
        "Binds": [
          "/var/influxdb2-data:/var/lib/influxdb2"
        ]
    }
}
Click on the Add button. The new module entry should be added to the list of modules.
Click on the Review + create button to complete the module deployment.
How to quickly setup test configuration with 100K variables.
To verify that the product meets specific performance requirements, as well as to create test data to store in the database and have some metrics about what disk space is required for specific amount of stored data values, what duration of network interruptions can be handled, you can run tests using demo OPC UA Server from Unified Automation, following steps in this section. We use 100,000 variables with 1000 millisecond sampling interval in our test case setup described below, you can use lower or higher numbers.
In general, our tests show that average throughput about 100,000 float values per second can be handled in most modern PCs, if InfluxDB is used as a destination time-series database. If you have lower number of variables, sampling interval can be faster, and if data is not changing too often, more variables can be processed. For example: 10,000 variables with 100 ms sampling rate would put the system into the same load as 200,000 variables with slower sampling interval 2000 ms.
Unified Automation demo server has a limit of 100,000 nodes to add. If you need to add more than 100,000 variables logged, you can create second server node to add more variables.
As a result of the increased load, it takes longer time for the server to process requests from the client, as well as communication messages between the client and the server becomes larger. For that reason, some configuration options in both client and server side need adjustment as described below.
Download and install
OPC UA C++ Demo Serverfrom Unified Automation web site: https://www.unified-automation.com/downloads/opc-ua-servers.htmlFind configuration file
ServerConfig.xmlunder default installation folderC:\Program Files (x86)\UnifiedAutomation\UaCPPServer\bin\, and modify values for the following options:
MaxSubscriptionsPerSession: 100
Serializer / MaxMessageSize: 33554432
Serializer / MaxAlloc 33554432
Restart the OPC UA Server to apply changes.
Increase number of variables under folder
Objects/Demo/007_Massfolder_Dynamicof the OPC UA C++ Demo Server. By default it has 1000 variables, and more nodes can be added to it at rutime, up to 100,000 variables.
To increase number of variables, the server has a method AddNodes under the node mentioned abobe. You can call it using UaExpert, client application from Unified Automation, available to download at https://www.unified-automation.com/downloads/opc-ua-clients.html
Tip
Calling of this method can be automated by adding methods node in the server’s advanced configuration settings dialog window. Switch the JSON editor to text mode to insert the following JSON member:
{
 "methods": [
   {
     "objectNodeId": "ns=2;s=Demo.Massfolder_Dynamic",
     "methodNodeId": "ns=2;s=Demo.Massfolder_Dynamic.AddNodes",
     "inputArguments": [
       {
         "dataType": "UInt32",
         "value": 10000
       }
     ]
   }
 ]
 }
Now the server has number of variable nodes ready to be logged with ogamma Visual Logger for OPC.
In the ogamma Visual Logger for OPC configuration GUI, add new server node in the
Address Spacepanel. In the openedOPC UA Server node settingsdialog window, enter endpoint URL for the demo server, as well as modify values of the following options:
timeout: 5000
in the JSON editor dialog window opened by clicking on the
Edit Advanced Optionsbutton:
publishRequestQueueSize : 10
delayBeforeReconnect : 5000
reconnectInterval : 10000
readServerStateInterval : 10000
timeoutReadServerState : 5000
requestTimeouts / createMonitoredItems : 10000
Note
These settings work in our test setup, where ogamma Visual Logger for OPC runs in a workstation with 32 Gb RAM, 8 core CPU, and 1 Tb SSD. You might need to increase those numbers in PC with lower performance.
Set logging options which will be used when you add new variables to the
Logged Variablestable.
When new variables added to the Logged Variables table, they will have parameters as Publishing Interval, Sampling Interval, and others, as they are configured in the currently selected variable group. By default both Sampling and Publishing Interval are set to 1000 ms. in the Default Group. If you need values different than default values, then you can modify them in the default variable group, or create new variable group with desired options and select it.
Now you can browse the OPC UA Server node in the
Address Spacepanel, by expanding the server node and its child nodes. But do not expand the node Objecs/Demo/007_Massfolder_Dynamic` which now has large numbers of varaibles under it, because rendering them all in the web browser takes too long time. Instead, hover mouse on the folder, and open the context menu. It will have one command:Log all first-level children. When you click on this menu command, all variables located directly under it will be added to theLogged Variablestable. It might take from 3 to 10 seconds to add them depending on the used hardware.
After adding variables, refresh configuration GUI web page in the browser. After refreshing, all variables should be added to the Logged Variables table, and shortly start getting values updated.
If they stay with bad status (red icon in the Status column), you can hover mouse on the icon in the Status column to display description of the status code.
If connection with the server cannot be established, increasing values of the options described above might help.
You can see some statistical information about total number of data values received from the server and others in the
Tools/Statisticsdialog window.
Tip
You can check number of currently logged variables in the bottom of the Logged Variables table, to the lefth from the page navigator. Total number of variables with bad and good status is displayed in the Logged Variables table header area.
Tip
Due to large number of records in the table, number of pages will be large (for 100,ooo variables and 10 records per page, there will be 10,000 pages). So moving to the specific page using page navigator becomes not effecient.
To quickly move to the specific page, use page selector, located at the top right corner of the Logged Variables table.
How to modify configuration options for large number of variables.
Sometimes you might need to modify configuration options for large number of variables. For example, change sampling interval for all variables for a specific server.
We have in the roadmap plans to add easy to use mass editing features right into the GUI. For now, you can modify settings by modifications in the configuration database by the database management tools.
You can see the type (SQLite or PostgreSQL) and location of the configuration database in the dialog window opened via menu Settings / Connection to the configuration database. Name of the table in the database where Logged Variables are stored is loggingNodes. You can modify it by using SQL database management tool. In case of SQLite (default type of the configuration database), you can use SQLite Browser available to download at https://sqlitebrowser.org/.
For example, to change Sampling Interval and Queue Size, for all variables under the server with id 1, you can execute the following SQL query:
UPDATE loggingNodes SET sampling_interval = 1000, queue_size=11 WHERE server_id = 1;
After making changes, don’t forget to save the changes (by clicking on the Write Changes icon.). To apply these changes, you can etierh restart ogamma Visual Logger for OPC, or de-activate the server node in the Address Space panel and activate it again.
Import variables from CSV file
When number of variables to log is large, it might be better to import list of variables from CSV file than select them from the address space and add manually. This section describes how list of variables can be imported from CSV file.
The configuration database can be located either in SQLite or PostgreSQL type database. You can see type of the database and its location via menu
Settings/Connection to the Configuration Database.Each database type has its own tools to import data, and some field data types differ in tables, therefore for each database type import procedure is described separately in the sections below.
In both cases name of the table where list of logged variables is stored is called
loggingNodes, so import of records from CSV file is performed into this table.Before importing records to the
loggingNodestable, create OPC UA Server nodes in theAddress Spacepanel. These records will be stored in tableserversin the configuration database. You will need value of the record identifier columnidfrom thisserverstable, to set in theserver_idcolumn in the CSV file with list of variables.
Import into SQLite configuration database.
Prepare CSV file with list of variables, using this template as a base:
template file for SQLite. Following columns should be modified:
id- enter unique integer identifier. If currently there are no variables, then start from 1. Otherwise, view tableloggingNpodesin the database, find out what is the value of last record’s id, and start with value incremented by one. Next record should have next value incremented by 1 and so on.
server_id- value of theidcolumn for the corresponding OPC UA Server record inserverstable.
display_name- display name for the variable.
opc_node_id- OPC UA node id, formatted as text with namespace index and identifier. For example:
ns=2;s=Demo.Massfolder_Dynamic.Variable0001- namespace index2, string type node identifierDemo.Massfolder_Dynamic.Variable0001.
ns=2;i=100- namespace index2, integer type node identifier100.
sampling_interval- sampling interval in milliseconds.
publishing_interval- publishing interval in milliseconds
queue_size- queue size for the monitored item values.
active- set to 1 if the variable values should be logged.Other columns can be set to default values as in the template file.
Download and install
SQLite DB Browserfrom https://sqlitebrowser.org/Stop ogamma Visual Logger for OPC.
Accessing SQLite database from two processes at the same time can cause errors, therefore stop the ogamma Visual Logger for OPC process before importing data.
Import records from prepared CSV file:
To import records into table
loggingNodes, open the database with SQLite DB browser. By default, configuration database is located in file./data/config.db(relative to the working directory of the ogamma Visual Logger for OPC process).From menu
Fileselect commandImport / Table from CSV file:
Select CSV file with list of variables.
In the
Import CSV filedialog window make sure that the theTable namefield is set tologgingNodes, and clickOKbutton.
On the warning dialog window click on the
Yesbutton. Records from the CSV file should be imported.
Import into PostgreSQL configuration database.
Prepare CSV file with list of variables, using this template as a base:
template file for PostgreSQL. Following columns should be modified:
id- enter unique integer identifier. If currently there are no variables, then start from 1. Otherwise, view tableloggingNpodesin the database, find out what is the value of last record’s id, and start with value incremented by one. Next record should have next value incremented by 1 and so on.
server_id- value of theidcolumn for the corresponding OPC UA Server record inserverstable.
display_name- display name for the variable.
opc_node_id- OPC UA node id, formatted as text with namespace index and identifier. For example:
ns=2;s=Demo.Massfolder_Dynamic.Variable0001- namespace index2, string type node identifierDemo.Massfolder_Dynamic.Variable0001.
ns=2;i=100- namespace index2, integer type node identifier100.
sampling_interval- sampling interval in milliseconds.
publishing_interval- publishing interval in milliseconds
queue_size- queue size for the monitored item values.
active- set tot(that is boolean true) if the variable values should be logged, or tof, if the variable should not be logged.Other columns can be set to default values as in the template file.
Have a database management tool available, with feature to import records to the database tables. In this manual we are using PgAdmin.
In PgAdmin, connect to the PostgreSQL server where ogamma Visual Logger for OPC configuration database is located. Expand the database, and select table
loggingNodes. Using menuTools/Import/Export, openImport/Export datadialog window:
In the
Import/Exportfield selectImport.Open
Select Filedialog window. On its toolbar, click on theUpload Fileicon. Double click on the central panel to open file selector and select CSV file, or drug and drop file from the file explorer windows into it.
The file should be uploaded to the server, and listed in the central panel. If it does not appear in the list, click on the upload icon one more time. Select the file name and click on the
Selectbutton.
Set option
HeadertoYes, and select comma,as a delimiter.
Click
OKto import records.Notification should appear in the PgAdmin GUI, reporting import result. If there were errors, click on the
More Detailsbutton in the notification message area to view what caused the import failure.Restart ogamma Visual Logger for OPC, or toggle option
Activein the OPC UA Server node settings to apply changes.
How to create and use self-signed OPC UA application instance certificate.
The ogamma Visual Logger for OPC as OPC UA application instance certificate uses X509 certificate, signed by CA certificate. Both CA certificate and instance certificate as well as CA CRL (certificate revocation list) are created automatically.
Some OPC UA Servers might only support self-signed instance certificates. Currently, the ogamma Visual Logger for OPC does not support creating of the self-signed certificate automatically, but it can use one if you create it by some third-party tool. This section describes how to create self-signed instance certificate using open source product XCA, and use it.
Install certificate management tool XCA.
Download from https://hohnstaedt.de/xca/index.php/download and install XCA.
Start XCA and create new database.
Use menu command
File / New DataBaseto create new database (XCA by default will use SQLite database file to store its data). Select folder, enter file name. In theNew Passworddialog window enter password used to access the database. Empty password is accepted, but as in this database private keys will be stored, it is recommended to enter password in case of production use.
Import instance certificate’s private key used by the ogamma Visual Logger for OPC.
Select tab page
Private Keysand click on theImportbutton (located on the right panel). In the file selection dialog, select file[PKI Root Folder]/own/private/private_Basic256Sha256.der. Here[PKI Root Folder]is data folder used by ogamma Visual Logger for OPC:./data/[InstanceId]/PKI/, where[InstanceId]is instance-specific folder.The private key will be imported and new line appear in the
Private Keystab page.
Import instance certificate’s public key.
Select tab page
Certificatesand click on theImportbutton (located on the right panel). In the file selection dialog, select file[PKI Root Folder]/own/certs/public_Basic256Sha256.der.The certificate public key will be imported and new line appear in the
Certificatestab page.
To re-use existing certificate fields, create new template.
In
Certificatestab, select imported certificate line in it, and open context menu by right click on the mouse. Select commandTransform / Template.
Using the template, create new certificate.
Select
Templatestab, right click on the template line to open context menu.Select command
Create certificate.In the
Subjecttab, check theUsed keys toobox, and in thePrivate Keydrop-down list select private key (which was imported before).In the
Extensionstab change value of the fieldTypetoCertificate Authority.In the
Key Usagetab,X509v3 Key Usagepanel add the optoinCertificate Sign.Click
OKbutton to create new certificate.
Just in case, create backup copy of the existing certificate public key file
[PKI Root Folder]/own/certs/public_Basic256Sha256.der.Stop ogamma Visual Logger for OPC.
Export new certificate to the location used by ogamma Visual Logger for OPC.
Select
Certificatestab, and select the certificate which was just created in the previous steps. It might be either the very first one or the last one. To find it, you can open a certificate line by double clicking and check the validity start period - the new certificate should have the start time close to the current time. Also, it should have checked box and text valueYesin the columnCA.Click on the
Exportbutton.In the
Certificate Exportdialog window, selectDER (*cer)in theExport Formatfield.In the
File namefield select or enter public key file[PKI Root Folder]/own/certs/public_Basic256Sha256.der. In case of using file selection dialog, in theSave as typefield selectAll filesto make files with extention.dervisible. Make sure that file extension is.der, not.cer.Click
OKbutton, and confirm overwriting it.Delete file
[PKI Root Folder]/own/certs/public_Basic256Sha256.pem(note: with extention.pem) - new one wil be created automatically, matching with the new certificate.
Start ogamma Visual Logger for OPC and verify that the new crificate can be used for secure communication.
Private key now can be deleted from the XCA database, to eliminate storing it in more than one place. Or the whole database can be deleted.
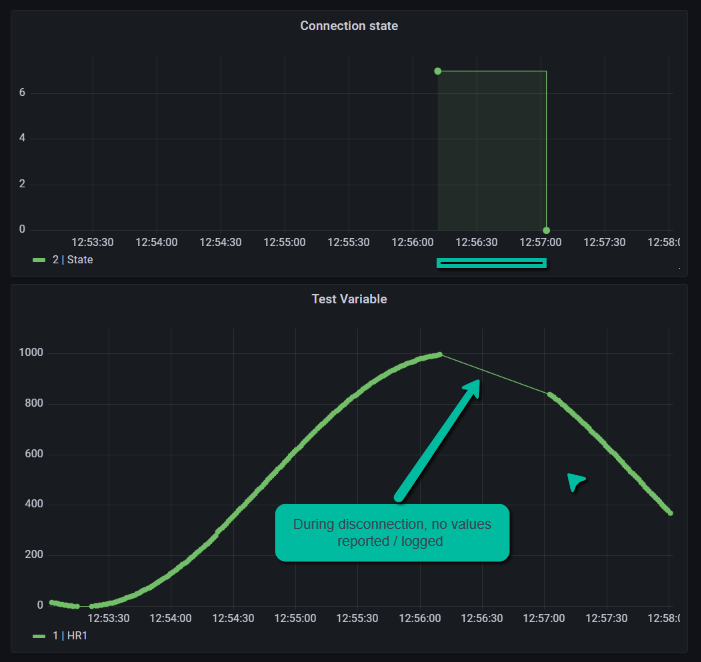
How to monitor state of connection with OPC UA Servers
To monitor state of connection with OPC UA Server, value for the standard variable Objects/ServerStatus/State can be logged into the time-series database.
This variable data type is ServerState, an enumeration defined at https://reference.opcfoundation.org/v104/Core/DataTypes/ServerState/. When value of this node is read from the server, it is almost always equal to 0 (Running). Therefore, just based on the value of the variable, it was hard to detect disconnections. Starting from version 2.1.9, when communication with the server is interrupted, ogamma Visual Logger for OPC reports its value as changed to 7, which means Unknown.
The following screenshot demonstrates how the connection state can be visualized in the Grafana dashboard. We can see a gap in data in the graph below which correlates with the connection state in the graph above.
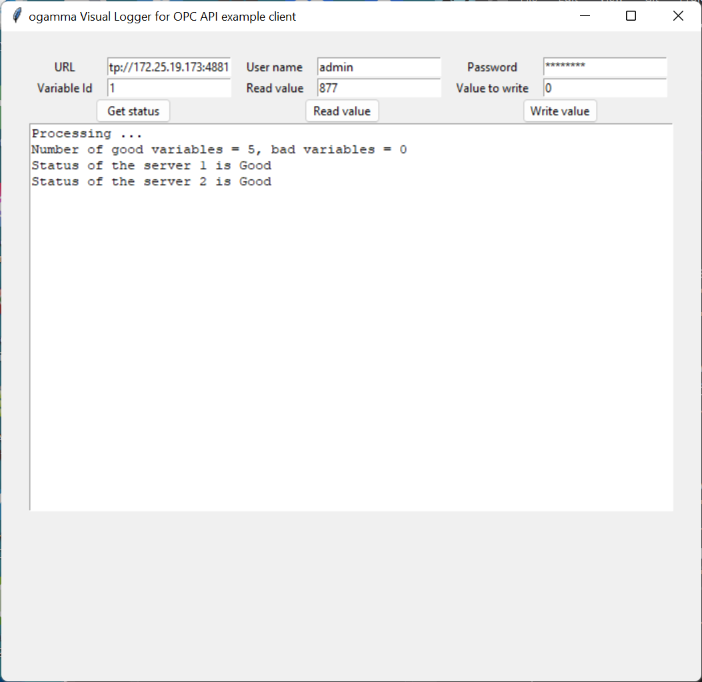
How to configure ogamma Visual Logger for OPC and monitor its state using REST API.
ogamma Visual Logger for OPC has web-based configuration GUI, which interacts with the backend using REST API. Potentially it is possible to use this API to change configuration settings as well as monitor state of the application from third party custom applications, for example, using Python scripts.
Example of the Python class encapsulating interactions with ogamma Visual Logger for OPC over REST API and Python desktop GUI application using it can be downloaded here: https://onewayautomation.com/visual-logger-docs/api-test-with-python.zip. The screenshot below demonstrates how server statuses are read and displayed in the text box:
How to add OPC UA Server connection settings and logged variables using Python scripts
Starting from version 2.1.14 of the ogamma Visual Logger for OPC distribution packages for Windows and Ubuntu Linux include folder
CreateConfigDbwith Python script illustrating how configuration settings can be created programmatically.The latest version of the script is also available at GitHub: https://github.com/onewayautomation/ogamma-logger
The script is used for the case when SQLite database is used as configuration database. It performs steps described below. You might need to modify variable values according to your specific installation setup.
Connects to the configuration database with path set in the variable
destinationDatabase.Creates (if not exists) new Collector Configuration, with name defined by variable
collectorConfigurationName. By default it will be calledTest Configuration. Using dedicated Collector Configuration is helpful to keep your existing settings separate from test configuration.Creates one or more new OPC UA Server connections, with endpoint URL defined by variables: * serverHostName * serverIpAddress * serverPortNumber
Number of connections is set by the variable
numberOfServers. Advanced options for the server connection are set to the content of JSON file with nameserverOptionsFileName. In this file you can set for example timeouts for different request types.When
numberOfServersis greater than 1, then for each next server port number is incrementd by 1.Note that
serverIpAddressis optional, it is used in case if from the host where the ogamma Visual Logger for OPC runs it is not possible to resolve server host name to IP address. This is common when ogamma Visual Logger for OPC runs in Docker container.For each server, creates logged variables. Number of these variables is defined by variable
numberOfVariables. OPC UA Node Id of the variable is composed using number of variable and template defined in variableloggingVariable. In the script using Unified Automation demo server is used, and variable node ids are composed accordingly. You can specify your own server’s node ids. Also, you can also use freeopcua OPC UA Python library and discover nodes ids by browsing your servers.For convenience you can use Microsoft Visual Studio 2022, Community Edition to edit the script and run it in debug mode.
Order of actions to create configuration settings in the configuration file are:
Start OPC UA Servers. In the example when Unified Automation OPC UA server is used, this can be done by running PowerShell script
StartServers.ps1.Note that using Unified Automation OPC UA Demo server assumes that OPC UA servers run in Windows machine, and installed in default location. The scripts creates separate configuration file for each server instance. In Linux machines it is stil possible to use PwerShell script after installing PowerShell for that OS.
Stop ogamma Visual Logger for OPC
Run the script CreateTestConfiguration.py (Python3 is required).
Start ogamma Visual Logger for OPC
Verify that new Collector Configuration is created using menu command
Settings/Collector Configurations.Assign new Collector Configuraiton to the Instance using menu command
Settings/Instances. From the list of instance, select current instance (in most cases there is only one). Click on theEditicon in the far right side of the line, and open dialog menu with Instance configuration settings. Assing new Collector Configuration in the fieldCollector Configuration.Save changed settings, close dialog windows and refresh web page.
Now you should see in the address space panel added servers, and list of variables in the
Logged variablestable.Note that the script creates server connection records with secured connection mode. Therefore, to be able to connect successfully, the ogamma Visual Logger for OPC needs to trust to the server certificate. To setup trust, you can try to browse OPC UA Server address space in
Address Spacepanel. When it tries to connect, it sould popup dialog window with server certificate, where you can accept the certificate as trusted. After that, make sure that you can connect to the server and browse its address space in theAddress Spacepanel. As the same server is used multiple times, they will all have the same certificate, and other server connections should be successful once you setup trust for the one of them. In case of connecting your own servers, you might need also setup in the server side trust to the ogamma Visual Logger for OPC certificate.To monitor performance metrics, you can use dialog window opened by menu command
Tools/Statistics.Note that when numbe of servers nad variables are high, you might need to increase number of threads in instance configuration settings and increase timeouts in server options.
When you are done running tests with these servers, you can modify the instance to use other Collector Configuration, and then delete this configuration
Test Configuration. This wil cleare all records created by the script from the configuration database keeping it clean.For more details and with questions please contact Support.
How to connect to Ignition OPC UA Server in secured mode.
If you are using Inductive Automation’s Ignition version 8.1.28 or earlier, you might have problem to connect to its OPC UA server in secured mode. After configuring client and server side certificates to be trusted, connection would fail with error message like Create session failed with error [An error occurred verifying security.].
Investigation showed that the root cause of the issue is that Ignition expects in Create Session call a single certificate to be sent by the client application. ogamma Visual Logger for OPC sends the whole chain of certificates, consisting in this case of 2 - the CA certificate and issued by it leaf, the application instance certificate. If only the leaf certificate is sent, then connection succeeds.
Fortunately, it is configurable in ogamma Visual Logger for OPC. Until the issue is fixed in Ignition, the workaround is:
First you try to connect as usual, accept the Ignition certificate as a trusted by the ogamma Visual Logger for OPC, and then 2 certificates will appear on Ignition server side as rejected on the Ignition configuration web page, Config/OPC UA/Security/Server tab. Click on the Trust button for each certificate, and they become trusted by Ignition.
Then from the Address Space panel you can open the OPC UA Server Node Settings dialog window, and click on the Edit Advanced Options button, and set option maxSentChainLength to 1. After that, the connection should succeed. You might need refresh the browser screen to apply the change.
Note that to connect to Ignition OPC UA Server, the Endpoint URL should be in full format, that is include /discovery after port number, for example: opc.tcp://gateway:62541/discovery
Connecting when ogamma Visual Logger for OPC and OPC UA Server run in different network environments.
It might be tricky to connect if the ogamma Visual Logger for OPC and OPC UA server are running in different environments - one in Docker, another in a regular box, due to the OPC server returning host name in the endpoint URL which cannot be resolved from the environment where the ogamma Visual Logger for OPC is running. To resolve this kind of issue ogamma Visual Logger for OPC has advanced option dnsMap. So for example if the server is running at the docker container with host name configured as gateway, the URL in the connection settings can be entered using this host name: like opc.tcp://gateway:62541/discovery, and under the dnsMap option you can enter fields: from - set to gateway, and the field to - set to IP address accessible from the host where ogamma Visual Logger for OPC is running(IPv4 format). ogamma Visual Logger for OPC will use this information to resolve the hostname gateway to IP address during connection.
Note that the ogamma Visual Logger for OPC has know issue: if connection to the server fails, to display added/edited server node it requires refreshing of the configation GUI page in browser.
Network issues on Siemens Simatic IoT2050
OVl was regularly loosing connection with OPC UA Server. The OVL was just stopping getting any messages from the server every few minutes. That was causing reconnection, and for that period data would be lost.
The OS log files were showing periodic disconnections. The command journalctl -xe was printing log messages like this:
`
Sep 26 21:55:15 iot2050-debian kernel: icssg-prueth icssg0-eth eno1: Link is Down
Sep 26 21:55:15 iot2050-debian systemd-networkd[802]: eno1: Lost carrier
Sep 26 21:55:15 iot2050-debian systemd-networkd[802]: eno1: DHCPv6 lease lost
Sep 26 21:55:16 iot2050-debian kernel: icssg-prueth icssg0-eth eno1: Link is Up - 1Gbps/Full - flow control off
Sep 26 21:55:16 iot2050-debian systemd-networkd[802]: eno1: Gained carrier
`
The solution was found in changing of the network switch. After connecting of the IoT2050 device to the local network with different, newer switch, the issue disappeared.